Computational design of sequence-specific DNA-binding proteins
Scaffold library generation
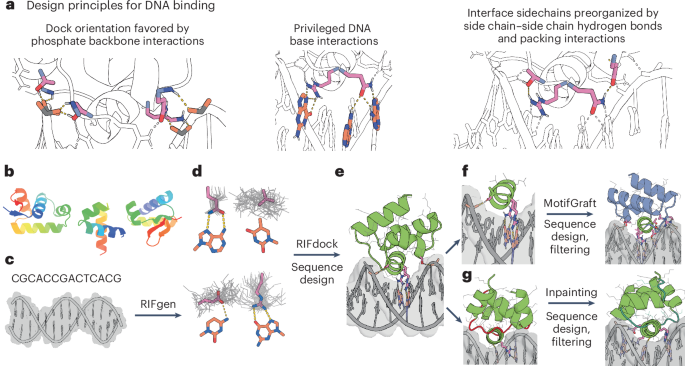
Scaffolds deposited to the PDB with structural similarity to selected template backbones (PDB 1L3L (ref. 51) and PDB 1PER (ref. 52)) were identified using TM-align29. Amino acid sequences of identified protein scaffolds were used as seeds to generate multiple-sequence alignments (MSAs) using an HHBlits53 search of the UniRef30 database54. Resulting MSAs were used for HMMer55 searches of the JGI metagenome protein sequence databases56 and the Uniref100 database54. HMMer search results were clustered to <70% sequence identity using MMSeqs2 (ref. 57) and MSAs were generated from each clustered sequence using HHBlits. AF2 (ref. 28) was used to predict structures for each sequence using the generated MSAs. Resulting scaffolds were filtered for high confidence AF2 pLDDT scores, TMscore to the input backbone templates and Rosetta score. Scaffolds of specific topologies were supplemented with additional AF2-predicted structures of TF sequences identified from bacterial metagenomes using DeepTF58. PSSMs were generated for each scaffold using PSI-Blast59 and custom code for use as constraints of Rosetta design. All final scaffolds are available for download.
RIF docking of scaffolds onto DNA targets (DBP design step 1)
Structures of B-DNA for each target (Supplementary Table 2) were generated by (1) using the DNA portion of PDB 1BC8 (ref. 60), PDB 1YO5 (ref. 61), PDB 1L3L (ref. 51) or PDB 2O4A (ref. 62) or (2) using the software X3DNA63, followed by a constrained Rosetta relax of the DNA structure. RIFdock was allowed to target along the entire stretch of each target sequence. The RIF docking method performs a high-resolution search of continuous rigid-body docking space. RIF docking comprises two steps. In the first step, ensembles of interacting discrete side chains (referred to as ‘rotamers’) tailored to the target are generated. Polar rotamers are placed on the basis of hydrogen-bond geometry, whereas apolar rotamers are generated through a docking process and filtered by an energy threshold. Rotamers were only calculated for nucleotide base atoms in the major groove of the DNA target. All the RIF rotamers are stored in ~0.5-Å sparse binning of the six-dimensional rigid-body space of their backbones, allowing extremely rapid lookup of rotamers that align with a given scaffold position. To enrich for canonical protein–DNA hydrogen-bond interactions, rotamers of arginine, glutamine and asparagine forming bidentate hydrogen bonds with G and A bases were extracted from the PDB, clustered by r.m.s.d., aligned to the DNA target at all G and A positions and added to the RIF as hotspot residues. To facilitate the next docking step, RIF rotamers are further binned at 1.0-Å, 2.0-Å, 4.0-Å, 8.0-Å and 16.0-Å resolution. In the second step, a set of scaffolds was docked into the produced rotamer ensembles, using a hierarchical branch-and-bound search strategy. Starting with the coarsest 16.0-Å resolution, an enumerative search of scaffold positions was performed; the designable scaffold backbone positions were checked against the RIF to determine whether rotamers could be placed with favorable interacting scores. All acceptable scaffold positions (up to a configurable limit, typically 10 million) were ranked and promoted to the next search stage. Each promoted scaffold was split into 26 child positions in the six-dimensional rigid-body space, providing a finer sampling. The search was iterated at 8.0-Å, 4.0-Å, 2.0-Å, 1.0-Å and 0.5-Å resolutions. All RIF docks were required to use at least one hotspot residue to be saved as an output.
Energy function optimization
The next steps of the DBP design pipeline after RIFdock involved sequence design and/or modeling protocols with Rosetta. To facilitate this, a new version of the Rosetta score function was trained to better evaluate the energy of protein–DNA interfaces. Additional flexibility of the DNA duplex was incorporated into Rosetta’s rotamer optimization and gradient-based minimization modules using modifications of DNA dihedral angles64 and the score function was optimized using the same general method as previously published65. The weights of individual terms in the score function were optimized to reproduce the geometries of DNA crystal structures. Specifically, the distributions of pairwise atomic distances, base-stacking and base-pairing geometries and bond torsions were considered. Additional optimization was performed on tasks related to protein–DNA complex structures. These tasks included energy ranking of perturbed crystal structures, rotamer recovery in repacking crystal structures and sequence recovery in redesigning the protein sequence of crystal structures. An additional weight was placed on the frequency of positively charged residues at interface positions because previous score functions tended to overestimate the strength of solvent-exposed charged interactions. Similar geometric and design tasks were included for protein structures alone. Rosetta score weights optimized included partial atomic charges of protein and DNA, hydrogen-bond strengths and solvation energies. The resulting score function showed improvement across nearly all tasks, with the greatest improvements found in the protein–DNA energy ranking and sequence design.
Rosetta-based interface sequence design (DBP design step 2, option A)
A stripped down version of the Rosetta score function was used to roughly design the interface of RIF dock outputs6. This step was primarily used to replace clashing residues before evaluating for design potential. Specifically, fa_elec, lk_ball[iso,bridge,bridge_unclp] and the _intra_ terms were disabled. All that remained were Lennard–Jones, implicit solvation and backbone-dependent one-body energies (fa_dun, p_aa_pp and rama_prepro). Additionally, flags were used to limit the number of rotamers built at each position (Supplementary Information). After the rapid design step, the designs were minimized twice: once with a low-repulsive score function and again with a normal-repulsive score function. Rosetta ΔΔG and contact molecular surface were then calculated on the roughly designed interface. A maximum-likelihood estimator was used to give each predicted design a likelihood that it should be selected to move forward. A subset of the docks to be evaluated were subjected to the full sequence design and their final metric values were calculated. With a goal threshold for each filter, each fully designed output can be marked as pass or fail for each metric independently. Then, by binning the fully designed outputs by their values from the rapid trajectory and plotting the fraction of designs that pass the goal threshold, the probability that each predicted design passes each filter can be calculated. From here, the probability of passing each filter may be multiplied together to arrive at the final probability of passing all filters. This final probability can then be used to rank the designs and pick the best designs to move forward to full sequence optimization. Note that the rapid design protocol here is used merely to rank the designs, not to optimize them; the original docks are the structures carried forward.
These docked conformations passing the rapid design protocol were further optimized to generate shape-complementary and chemically complementary interfaces using a Rosetta FastDesign protocol, alternating between side-chain rotamer optimization and gradient-descent-based energy minimization. Design was performed with a sequence profile constraint based on an MSA of the originating native scaffold sequence and cross-interface interactions upweighted to maximize contacts and shape complementarity. We did not allow Rosetta to repack or relax the DNA target during the design procedure. A Python script was implemented to automatically carry out rapid design evaluation, preemption and full sequence design. Computational metrics of the final design models were calculated using Rosetta, which includes ΔΔG, hydrogen bonds to base atoms and contact molecular surface, among others, for design selection. All the script and flag files to run the programs are provided in the Supplementary Information. ProteinMPNN was used to redesign noninterface residues in the final design step, before AF2 monomer validation.
LigandMPNN-based sequence design (DBP design step 2, option B)
LigandMPNN was used for sequence design in the context of DNA. The network was used to optimize the protein sequence for given protein–DNA complex structures during design, whereby amino acids were determined autoregressively by the identity and location of neighboring protein and DNA residues. When the full protein sequence was determined, it was threaded onto the input protein scaffold. As in the above Rosetta-based interface sequence design protocol, the designs were minimized with a low-repulsive score function and again with a normal-repulsive score function and Rosetta ΔΔG and contact molecular surface were calculated on the roughly designed interface. A maximum-likelihood estimator was used to pre-empt design of poor docks as described in the above Rosetta-based sequence design protocol. A Python script was implemented to automatically carry out MPNN sequence design, rapid design evaluation, preemption and Rosetta Relax. Computational metrics of the final design models were calculated using Rosetta, which includes ΔΔG, interface hydrogen bonds and contact molecular surface, among others. LigandMPNN temperatures of 0.2–0.3 were used earlier in the design process to increase the variability of amino acid sequences, while a temperature of 0.1 was used later to determine the more probable sequences. Key residues making base-specific hydrogen bonds with DNA atoms were fixed in later stages of the pipeline to encourage the design of supporting residues. All the script and flag files to run the programs are provided in the Supplementary Information.
Backbone resampling with motif grafting (DBP design step 3, option A)
Motif grafting was performed as previously reported6. Briefly, the binding energy and interface metrics for all the continuous secondary structure motifs (helix, strand and loop) were calculated for the designs generated in the broad search stage, as performed in previous work6. The motifs with good interactions (based on binding energy and other interface metrics, such as contact molecular surface) with the target were extracted and aligned using the target structure as the reference. All the motifs were then clustered on the basis of an energy-based TM-align-like clustering algorithm29 without any further superimposition. The best motif from each cluster was then selected on the basis of the per-position weighted Rosetta binding energy, using the average energy across all the aligned motifs at each position as the weight. Around 500–2,000 best motifs were selected and the scaffold library was superimposed onto these motifs using the MotifGraft mover66. Interface sequences were further optimized and computational metrics were computed for the final optimized designs as described in the Rosetta-based and LigandMPNN-based sequence design methods.
Backbone remodeling with protein inpainting (DBP design step 3, option B)
Scaffold secondary structures were determined using DSSP67. ProteinInpainting contigs were generated for each design that mask scaffold loops longer than four residues and surrounding residues while ensuring that all residues forming hydrogen bonds to the DNA backbone were conserved. In total, 10–20 unique contigs were generated for each design and sequences were constrained to a maximum of 65 aa. ProteinInpainting outputs were aligned to the DNA target using fixed interface residues of the input structure. The aligned ProteinInpainting outputs were subject to several further LigandMPNN + FastRelax rounds (DBP design steps 4 and 5) before AF2 monomer prediction and superposition steps.
AF2 monomer validation and superposition (DBP design step 5)
AF2 structures were produced using the single sequence of each design. AF2 was run with model 1 and 12 recycles for each design. The Cα r.m.s.d. of the AF2 structures to each respective design model was calculated. AF2 structures were superpositioned onto the DNA target using the backbone coordinates of interface residues within 8 Å of the DNA target. A fixed backbone Rosetta FastRelax was performed on each superpositioned complex and all relevant metrics were calculated on the final superpositioned design model.
Design filtering (DBP design step 6)
Designs were filtered after each sequence design step and after superimposition of AF2 models for those with the most favorable free energy of binding (Rosetta ΔΔG), contact molecular surface area6 and interface hydrogen bonds, the fewest interface buried unsatisfied hydrogen-bond donors and acceptors and those containing bidentate side chain–base hydrogen-bonding arrangements frequent in the PDB, including bidentate interactions of R–G, Q–A and N–A. Designs were additionally filtered for those with a high RotamerBoltzmann score (see below) among arginine, lysine, glutamine or asparagine residues forming hydrogen bonds with bases (max rboltz RKQE) and those with a high median RotamerBoltzmann (median rboltz) score of all residues forming hydrogen bonds with bases.
RotamerBoltzmann filters
The Boltzmann probability of finding a given rotamer in a specific state was evaluated using the RotamerBoltzmannWeight filter in Rosetta32. The RotamerBoltzmann score is an approximation of preorganization of a given residue in the unbound state. All amino acid residues forming hydrogen bonds with DNA base or phosphate atoms were evaluated by this metric, which was calculated on the protein monomer in the unbound state. The metric was estimated by fixing neighboring side chains and assessing the Boltzmann probability distribution on rotamers accessible by the side chain of interest. To increase the likelihood of a given rotamer in the protein–DNA complex, designs with lower RotamerBoltzmann scores (a score of 0 implies the rotameric state is unpopulated and a score of 1 implies the state is the only populated state) were preferentially chosen, as known native protein–DNA crystal structures tend to contain preorganized amino acid residues (Supplementary Fig. 2).
Analysis of design from native cocomplexes
To examine the ability of LigandMPNN-based sequence design to generate interfaces passing our in silico metrics when starting from crystal structures of native cocomplexes, we identified cocomplexes from the PDB with high TM-align to the designed DBPs. We mutated the DNA sequence in silico to the target sequence. In cases where the register of the DNA in the crystal structure complex did not match the design model, we systematically slid the design motif sequence, exploring all possible offsets and generating rethreaded structures for each sequence alignment. We used LigandMPNN to redesign the entire protein sequence of each native complex followed by side-chain relaxation using Rosetta FastRelax. To assess the resemblance between redesigned natives and designed DBP motifs, we examined whether the same amino acids formed hydrogen bonds with the same DNA base atoms (motif interaction recovery).
DNA library preparation
All protein sequences were padded to 65 aa by adding a (GGS)n linker at the C terminus of the designs to avoid the biased amplification of short DNA fragments during PCR reactions. The protein sequences were reverse-translated and optimized using DNAworks2.0 (ref. 68) with the Saccharomyces cerevisiae codon frequency table. Oligonucleotide pools encoding the designs were purchased from Agilent Technologies.
All libraries were amplified using Kapa HiFi polymerase (Kapa Biosystems) with a qPCR machine (Bio-Rad, CFX96). In detail, the libraries were first amplified in a 25-μl reaction and the PCR reaction was terminated when the reaction reached half-maximum yield to avoid overamplification. The PCR product was loaded onto a DNA agarose gel. The band with the expected size was cut out and DNA fragments were extracted using QIAquick kits (Qiagen). Then, the DNA product was reamplified as before to generate enough DNA for yeast transformation. The final PCR product was cleaned up with a QIAquick cleanup kit (Qiagen). For the yeast transformation step, 2–3 µg of linearized modified pETcon vector (pETcon3) and 6 µg of insert were transformed into the EBY100 yeast strain using a previously described protocol69.
DNA libraries for deep sequencing were prepared using the same PCR protocol, except the first step started from yeast plasmid prepared from 5 × 10⁷ to 1 × 10⁸ cells by Zymoprep (Zymo Research). Illumina adaptors and 6-bp pool-specific barcodes were added in the second qPCR step. Gel extraction was used to obtain the final DNA product for sequencing. All the different sorting pools were sequenced using Illumina NextSeq sequencing.
Yeast surface display
S. cerevisiae EBY100 strain cultures were grown in C −Trp −Ura medium supplemented with 2% (w/v) glucose. For induction of expression, yeast cells were centrifuged at 6,000g for 1 min and resuspended in SGCAA medium supplemented with 0.2% (w/v) glucose at the cell density of 1 × 10⁷ cells per ml and induced at 30 °C for 16–24 h. Cells were washed with PBSF (PBS with 1% (w/v) BSA) and labeled with biotinylated targets using two labeling methods: with avidity and without avidity. For the with-avidity method, the cells were incubated with biotinylated target, together with anti-c-Myc fluorescein isothiocyanate (FITC; Miltenyi Biotech) and streptavidin–phycoerythrin (SAPE; Thermo Fisher). The concentration of SAPE in the with-avidity method was used at one quarter of the concentration of the biotinylated targets. For the without-avidity method, the cells were first incubated with biotinylated targets, washed and secondarily labeled with SAPE and FITC.
Cell sorting of labeled yeast pools was performed using a Sony SH800S cell sorter. Libraries of designs were sorted using the with-avidity method for the first few rounds of screening to exclude weak binder candidates, followed by several without-avidity sorts with different concentrations of targets. For SSM libraries, two rounds of with-avidity sorts were applied and, in the third round of screening, the libraries were titrated with a series of decreasing concentrations of targets to enrich mutants with beneficial mutations.
For yeast display characterization of individual designs, including competition assays, DNA sequences encoding the proteins of interest were purchased as Integrated DNA Technologies (IDT) E-Blocks, transformed into yeast cells and incubated in 96-well culture plates. Labeling with biotinylated dsDNA targets and SAPE/FITC was performed in a 96-well plate format. Of the 44 designs that were confirmed to bind their intended target in clonal yeast display experiments, (Extended Data Fig. 1), we categorized 14 with detectable binding to fewer than three of the 13 tested DNA targets (Extended Data Fig. 2) as specific binders and the remainder as nonspecific.
For yeast display competition assays, labeling was performed without avidity using 1 µM biotinylated dsDNA duplex oligos and an excess of 8 µM nonbiotinylated competitor dsDNA duplex oligos. As indicated in figure captions, some competition assays for higher-affinity binders were carried out with lower dsDNA oligo concentrations. Flow cytometry analysis was performed with an Attune NxT flow cytometer with autosampler. Flow cytometry data analysis was performed using custom Python code and the CytoFlow python package. For each individual sample, gating of the expression population was performed using the CytoFlow Gaussian mixture model and the ratio of SAPE channel intensity to FITC channel intensity (binding signal/expression signal) was calculated for all gated expression events of the sample.
Deep sequencing analysis
The Pear program was used to assemble the fastq files from the deep sequencing runs. Translated, assembled reads were matched against the ordered design to determine the number of counts for each design in each pool. In each sequenced pool, binder enrichment was calculated by determining the percent of reads for each binder design in the pool and dividing this number by the same value in the naive expression sort pool. Designs were considered binders if >100-fold enrichment was observed in the last 1 µM with-avidity sort to the designed dsDNA target. For SSM libraries, apparent SC50 was estimated using the fitting procedure described in ref. 6.
Protein expression and purification
DNA sequences encoding the proteins of interest were purchased as IDT E-Blocks and incorporated into plasmids using Golden Gate assembly. The plasmids were then transformed into BL21(DE3) competent E. coli. The transformation reactions were used to inoculate starter cultures in 5 ml or 25 ml of Terrific Broth (TB), supplemented with 1% (w/v) glucose and 50 mg L−1 kanamycin. After shaking overnight at 37 °C, the starter cultures were diluted 50-fold into 50 ml or 500 ml of TB with kanamycin. These cultures were incubated at 37 °C, shaking, until the optical density reached 0.6–0.8, at which point protein expression was induced by the addition of IPTG. The cultures were then further incubated overnight at 18 °C. Cells were harvested by centrifugation for 15 min at 3,000g, pellets were resuspended in lysis buffer (150 mM NaCl, 20 mM Tris-HCl, 0.5 mg ml−1 DNAse I and 1 mM PMSF, pH 8.0), the cells were lysed by sonication and the lysate was clarified by further centrifugation for 30 min at 20,000g. The supernatant was passed through Ni-NTA resin in a gravity column and then the resin was washed with 20 column volumes of high-salt wash buffer (2 M NaCl, 20 mM Tris-HCl and 20 mM imidazole, pH 8.0). Either the His-tagged protein was eluted with two column volumes of elution buffer (1 M NaCl, 20 mM Tris and 250 mM imidazole, pH 8.0) or the resin was further washed with five column volumes of SNAC buffer (100 mM CHES, 100 mM acetone oxime, 100 mM NaCl and 500 mM GnCl, pH 8.6), incubated in five column volumes of SNAC buffer + 0.2 mM NiCl2 on an orbital shaker at room temperature overnight and collected as the column flowthrough. Whether cleaved or not, the protein was concentrated to about 1 ml and loaded in 500-μl samples onto a Cytiva Superdex 75 Increase 10/300 GL gel filtration column equilibrated in buffer (1 M NaCl and 20 mM Tris-HCl, pH 8.0). Fractions containing monomeric protein were pooled and concentrated to about 200 μl. Protein concentrations were estimated spectroscopically by absorbance at 280 nm. For proteins with no tryptophan, tyrosine or cysteine residues, concentrations were approximated by Bradford reagent absorbance at 470 nm in comparison to BSA standards of known concentration.
BLI
BLI binding data were collected on an Octet R8 (Sartorius) and processed using the instrument’s integrated software. Biotinylated dsDNA oligos were loaded onto streptavidin-coated biosensors (ForteBio) at 200 nM in PBS + 1% BSA + 0.05% Tween-20 for 6 min. Analyte proteins were diluted from concentrated stocks into the binding buffer. After baseline measurement in the binding buffer alone, the binding kinetics were monitored by dipping the biosensors in wells containing the target protein at the indicated concentration (association step) and then dipping the sensors back into baseline or buffer (dissociation). Data were analyzed and processed using ForteBio Data Analysis software v.9.0.0.14.
Crystallization and structure determination
Purified DBP 48 was complexed with duplex DNAs, of varying duplex length and a single 5′ overhang base, to a final concentration of 176 µM DBP 48 and 233 µM duplex DNA. Complexes were screened for crystals in several broad matrix screens using a mosquito robot (SPT LabTech); then, possible hits were optimized in 24-well hanging drop trays with a 2-μl drop containing a 1:1 ratio of complex to well solution and equilibrated over 1 ml of well solution. A single diffraction-quality crystal was obtained with duplex DNA of length 10 bp with a single base overhang at either end of the duplex (5′-ACCTGACGCGA-3′, 3′-GGACTGCGCTT-5′) and a well condition containing 200 mM ammonium acetate, 100 mM sodium acetate at pH 4.6 and 28% PEG4000. The crystal was washed in well solution and then flash-cooled directly by plunging into liquid nitrogen. Data were collected at the Advanced Light Source in Berkeley on beam line 5.0.1 at a wavelength of 0.9762 Å and processed with DIALS70. Phases were determined through molecular replacement by searches with the original computational protein design and duplex DNA using Phaser71 in the PHENIX suite72. The top-scoring molecular replacement solutions were run through a round of refinement with PHENIX refine and further rounds of refinement with PHENIX refine and rebuilding with Coot73 were performed on the top-scoring structure. Data collection and refinement statistics are reported in Table 1.
uPBMs
uPBM experiments were carried out following the standard PBM protocol38,39. Briefly, we first performed primer extension to obtain dsDNA oligonucleotides on the microarray. Next, each microarray chamber was incubated with a 2% milk blocking solution for 1 h, followed by incubations with a PBS-based protein-binding mixture for 1 h and Alexa488-conjugated anti-His antibody (1:20 dilution; Qiagen, 35310) for 1 h. The array was gently washed as previously described38 and then scanned using a GenePix 4400A scanner (Molecular Devices) at 5-μm resolution. Data were normalized and processed with standard analysis scripts38,39.
RFdiffusion-based design of DBP–TetR fusion linkers, homodimers and heterodimers
For TetR fusions, diffusion inputs were generated by manually aligning DBP domains (DBPs 48, 57 and 69) symmetrically relative to the TetR homodimer scaffold. A total of 10,000 RFdiffusion trajectories were run per input to generate rigid linkers between the DBP domains and the TetR homodimer scaffold. ProteinMPNN sequence design was performed on dimer diffusion outputs with tied positions between the two units and most residues of the DBP fixed, only allowing the design of DBP residues nearby the newly diffused linker region. Homodimer complexes were predicted with ESMFold because of the inability of AF2 to predict the MPNN-designed TetR backbones. Predicted structures were filtered on the r.m.s.d. of the predicted DBP regions to the input DBP domains and ESMFold pLDDT to select 96 designs across the three inputs.
For homodimer and heterodimer design, diffusion inputs were generated by aligning DBP domains (DBPs 9, 35opt, 57 and 69) symmetrically or asymmetrically onto DNA. A total of 10,000 RFdiffusion trajectories were run per input to generate C2-symmetric homodimers or asymmetric heterodimers between the DBP domains. ProteinMPNN sequence design was performed on diffusion outputs with tied positions between the two units (for homodimers) and most residues of the DBP fixed. Complexes were predicted with AF2 and filtered on r.m.s.d. of the predicted DBP regions to the input DBP domains and pLDDT to select 96 homodimer designs and 96 heterodimer designs.
Transcriptional repression assays in E.
coli
The pRF-TetR vector40 was used for transcriptional repression assays in E. coli. A new version of this vector (pRF-BsmB1) was constructed by first removing the LuxR gene and then replacing the TetR gene, its terminator sequence and regulated promoter with two BsmB1 cut sites such that new repressor variants and their associated promoters could be easily inserted by Golden Gate assembly74. For DBPs tethered with a flexible linker, a flexible linker was used to connect the C and N termini of two copies of the DBP (linker 1, KESGSVSSEQLAQFRSLD; linker 2, EGKSSGSGSESKST; linker 3, GGGGGGGG; linker 4, GSGSGSGSGSGSGSGS). Synthetic promoters were designed by inserting DNA-binding sites around the consensus −10 and −35 elements of the E. coli RNA polymerase promoter. Genes encoding the single-domain DBP, flexibly linked TetR fusions, homodimers and heterodimers were ordered as Twist synthetic gene fragments encoding the repressor gene (using Twist codon optimization), a transcriptional terminator and an associated synthetic promoter. Heterodimer constructs were encoded into bicistronic operons. Gene fragments were ordered containing BsmB1 cut sites on either end to allow for assembly into the modified pRF-BsmB1 vector. Upon Golden Gate assembly with the BsmB1 Type II-S restriction enzyme, plasmids were transformed into NEB 5α competent E. coli cells and streaked onto Luria–Burtani (LB) plates containing carbenicillin. All-by-all repressor constructs (Fig. 5c) were cloned by digestion with BsiWI-HF (New England Biolabs) and BbsI (New England Biolabs), followed by gel extraction of the backbone and promoter bands, ligation with T4 DNA ligase and transformation into NEB 5α competent E. coli.
Individual transformants were picked and verified by Sanger sequencing. Sequence verified colonies were inoculated into 200 µl of LB medium containing carbenicillin for overnight growth in 96-well round-bottom plates at 37 °C in a plate shaker. The following day, 2 µl of overnight cultures were transferred into a new plate with 200 µl of LB medium containing carbenicillin and appropriate concentrations of IPTG (1 mM in Fig. 5c) and grown for ~18 h in 96-well round-bottom plates at 37 °C. Flow cytometry analysis of cultures was performed with an Attune NxT flow cytometer with autosampler. Flow cytometry data analysis was performed using custom Python code and the CytoFlow python package. For each individual sample, gating was performed using the single component CytoFlow Gaussian mixture model and median BL1-A channel fluorescence was determined for all gated expression events of each sample. The median BL1-A channel fluorescence value of empty cells without a pRF vector was subtracted from the median BL1-A value of each sample. For each repressor variant in Fig. 5c and Extended Data Fig. 9d, fold repression was calculated from at least seven biological replicates as the ratio of median BL1-A channel fluorescence of the uninduced sample (background-subtracted) to the median BL1-A channel fluorescence of the induced sample (background-subtracted).
Statistics and reproducibility
Statistical methods and the reproducibility of experiments are indicated in the respective figures. No data were excluded from the analyses. Data distribution was assumed to be normal but this was not formally tested. No statistical method was used to predetermine sample size but sample sizes were chosen to be consistent with those reported in previous publications6. The experiments were not randomized. The investigators were not blinded to allocation during experiments and analysis.
Transcriptional activation in HEK293T cells
HEK293T cells purchased from the American Type Culture Collection expressing the PEmax were cultured in high-glucose DMEM (Gibco), supplemented with 10% FBS (Rocky Mountain Biologicals) and 1% penicillin–streptomycin (Gibco). Cells were grown with 5% CO2 at 37 °C. A total of 1 × 10⁵ cells were seeded on a 48-well plate 1 day before transfection. Enhancer plasmid and binder plasmid were mixed with a ratio of 2:1. Enhancer variants and background control were mixed with a ratio of 2:2:2:1. A total of 300 ng of plasmid was transfected using Lipofectamine 3000 (Thermo Fisher, L3000015), following the manufacturer’s protocol. Three synTF-specific recorders and 1 TCF−LEF− recorder (negative control) were mixed with ratio 2:2:2:1 and cotransfected with synTFs into the HEK293T cells expressing PEmax. Three different spacings were tested—1 bp, 3 bp and 5 bp—between the palindromic binding motifs to maximize the recorder activity. Cells were harvested and analyzed 2 days after transfection. Genomic DNA was extracted on the basis of a protocol described previously43. Briefly, cells were lysed using freshly prepared lysis buffer (10 mM Tris-HCl pH 7.5, 0.05% SDS and 25 μg ml−1 protease (Thermo Fisher)) for each well. The genomic DNA mixture was incubated at 50 °C for 1 h, followed by an 80 °C enzyme inactivation step for 30 min. The DNA TAPE was amplified from the genomic DNA directly for next-generation sequencing. Recorded information was extracted using custom analysis code. Each enhancer has a unique barcode representing its activity. Transcription activation was measured as the fold change in the barcode abundance relative to the negative control barcode. All measurements were performed in triplicates. Error bars represent the s.d. of the mean relative barcode abundance.
Reporting summary
Further information on research design is available in the Nature Portfolio Reporting Summary linked to this article.
link


