Design method for out-of-plane motion rejecting structure in 2-DoF large stroke actuators
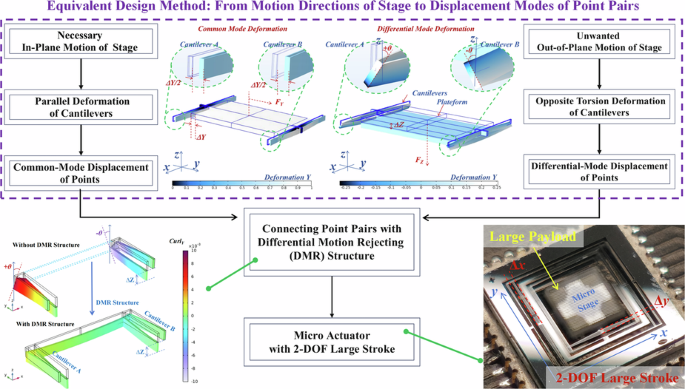
The methodology is elucidated in detail, complemented by a case study of an electromagnetic large displacement MEMS actuator that has undergone a design-simulation-manufacturing-testing sequence. The outcomes of analytical and experimental evaluations underscore the efficacy of the proposed design method for out-of-plane motion suppression structures. This is evidenced by the achievement of static and dynamic travel ranges of ±60 μm (peak-to-peak 120μm) and ±400 μm (peak-to-peak 800 μm), with low increase in the stiffness along the X and Y axes, concurrent with a significant enhancement in Z-axis stiffness.
Theory
In the initial segment of this part, a comprehensive analysis is undertaken to examine the stress conditions of a representative elastic frame subjected to non-planar loading. This analysis revealed that the torsional stiffness of the beam structure, rather than its bending stiffness, is the predominant factor influencing the overall out-of-plane stiffness of the frame.
Further investigation identified specific pairs of points that are crucial for the frame’s motion. It is observed that during in-plane orthogonal movement of the elastic frame’s micro stage along the X and Y axes, the motion between these critical points within each pair manifests a common-mode state. In contrast, during the out-of-plane movement of the micro stage, these pairs exhibit a differential-mode motion.
Based on these insights, an innovative equivalent design methodology is proposed in the subsequent section. This design method incorporates a linkage structure between paired points in the elastic frame, engineered to exhibit distinct deformation characteristics: during out-of-plane motion of the microstage, the linkage undergoes deformation due to differential-mode displacement between points, where the structural stiffness effectively constrains parasitic out-of-plane movement; whereas under in-plane motion, the linkage maintains rigidity through common-mode displacement synchronization, preserving the native in-plane kinematic performance.
For detailed analysis, the material and dimensional parameters are listed in Table 1.
Analysis of typical elastic frame structures
Figure 1 provides a schematic illustration of the beam structure’s distinct deformation behaviors during in-plane and out-of-plane motions. In the case of in-plane motion, as detailed in Fig. 1a, beam A and B are observed to undergo synchronized parallel displacements, preserving their alignment at the bending points and showing a uniform separation of ΔY/2. This uniform displacement pattern is indicative of a motion without a differential mode component.
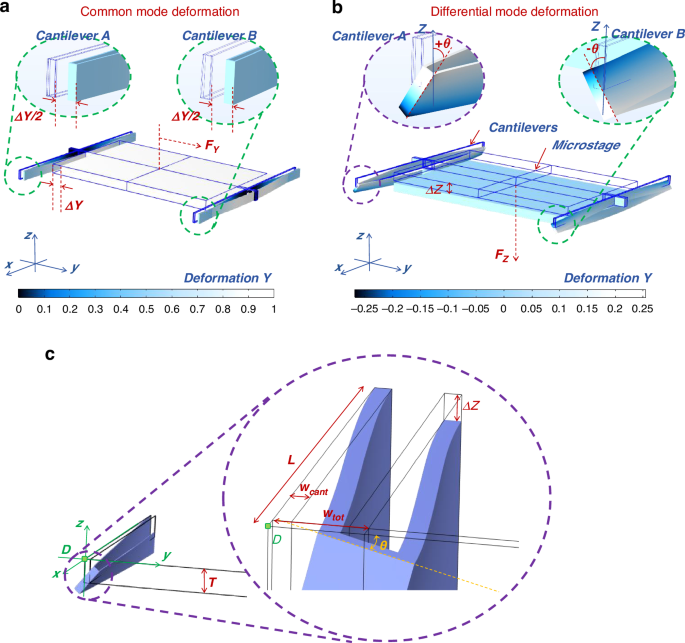
a During in-plane motion, Cantilever A and Cantilever B exhibit identical deformation and kinematic characteristics: b During out-of-plane motion, Cantilever A and Cantilever B exhibit opposite deformation and kinematic characteristics. c A schematic diagram of the deformation at the bending section of the beam structure during out-of-plane motion. At this time, the deformation of the beam structure can be considered to be composed of two parts: bending deformation and torsional deformation
In the subsequent analysis of out-of-plane motion, Eq. (4) reveals the geometric interaction between the elastic frame and its supporting beam structure. This interaction describes their deformation characteristics under a load applied perpendicular to the plane of the structure. Specifically, the total displacement along the out-of-plane axis (the Z-axis) is the sum of two separate components: the bending deflection of the beam structure, denoted as Δz, and the deformation due to torsional effects, represented by the product of the torsional angle θ and the total width Wtot, as shown in Fig. 1b, c. This detailed displacement analysis characterizes the structure responds to out-of-plane loading, highlighting the individual contributions of bending and torsion to the overall deformation.
$$\Delta Z=\Delta z+\theta \cdot {W}_{tot}$$
(4)
Decompose the total load FZ to obtain the formula in the form of Eqs. (5) and (6). By combining Eq. (6) with Eq. (4), which aligns with the definition of two springs connected in series, the total stiffness is given by Eq. (7).
$${F}_{Z}={k}_{t}\cdot \theta +{k}_{z\_bend}\cdot \Delta z$$
(5)
$${F}_{Z}=\frac{{k}_{t}}{{W}_{tot}}\cdot (\theta \cdot {W}_{tot})+{k}_{z\_bend}\cdot \Delta z$$
(6)
$${k}_{tot}=\frac{1}{{({k}_{t}/{W}_{tot})}^{-1}+{k}_{z\_bend}^{-1}}$$
(7)
where
$${k}_{z\_bend}=\frac{E}{{L}^{3}}\cdot {T}^{3}{W}_{cant}$$
(8)
and
$$\frac{{k}_{t}}{{W}_{tot}}=\frac{G}{3L{W}_{tot}^{2}}\cdot T{W}_{cant}^{3}$$
(9)
Equations (8) and (9) present the calculation methods for torsional stiffness kt and bending stiffness kz_bend, respectively. In this context, bending and torsional phenomena are theoretically represented as a series connections of two springs within a single elastic structure.
In a series spring configuration, as derived from Eq. (10), an influence coefficient denoted as Rtwist is extracted, as shown in Eq. (11). Rtwist refers to the ratio between the bend stiffness and torsional stiffness. High Rtwist, or low Rtwist-1 indicates that, the total stiffness is mainly decided by the tortional motions, rather than the bend deformations, and vice versa. Drawing upon Eq. (11), the total out-of-plane motion stiffness of the elastic frame is influenced jointly by the bending stiffness of the rectangular beam, kz_bend, and the torsional influence coefficient Rtwist. Effectively suppressing the torsional motion of the supporting beam, reducing the torsional influence coefficient Rtwist, is a crucial strategy for enhancing the out-of-plane stiffness.
$${k}_{z\_tot}=\frac{{k}_{z\_bend}}{1+{R}_{twist}}$$
(10)
where,
$${R}_{twist}=\frac{{k}_{z\_bend}}{{k}_{t}/{W}_{tot}}=6(1+\nu )\cdot \frac{{W}_{tot}^{2}}{{L}^{2}}\cdot {\left(\frac{T}{{W}_{cant}}\right)}^{2}$$
(11)
To more intuitively analyze the impact of device design and manufacturing parameters, the next section will replace the main parameters involved in Eqs. (8–11) with process capability indices, thereby establishing a correlation between process capability indices and the stiffness indices of the elastic frame.
A bridge from process specifications to stiffness metrics
The critical dimension, CD, and the aspect ratio, AR are two of the core specifications of the bulk silicon process28, as shown in Eq. (12).
$$\left\{\begin{array}{llll}CD&=&{W}_{Cant} & (a)\\ AR&=&T/{W}_{Cant} & (b)\end{array}\right.$$
(12)
Replacing T and Wcant in the “stiffness equations”, as shown in Eqs. (3) and (8–11), with the key process specifications, AR and CD, the corresponding relationship between the process specifications to stiffness metrics can be observed as shown in Eqs. (13–16).
$$\frac{{k}_{t}}{{W}_{tot}}=\frac{G}{3L{W}_{tot}^{2}}\cdot AR\cdot C{D}^{4}$$
(13)
$${k}_{y}=\frac{E}{{L}^{3}}\cdot AR\cdot C{D}^{4}$$
(14)
$${k}_{z\_bend}=\frac{E}{{L}^{3}}\cdot A{R}^{3}\cdot C{D}^{4}$$
(15)
$${R}_{twist}=6(1+\nu )\cdot \frac{{W}_{tot}^{2}}{{L}^{2}}\cdot A{R}^{2}$$
(16)
From Eq. (13–16), it can be seen that the in-plane stiffness ky is directly proportional to the 1st power of AR (∝ AR ⋅ CD4, Eq. (13)), while the out-of-plane bending stiffness kz_bend is proportional to the 3rd power of AR (∝ AR3 ⋅ CD4, Eq. (15)). The trends towards smaller CD and larger AR are important in the development of etching processes. Disregarding the variable kt, it is anticipated that, in conjunction with the ongoing refinements in etching technology, the parameter kz_bend will exhibit a progressive increment, whereas ky will undergo a corresponding decrement. This trend suggests an enhancement in both the stroke and the off-plane stiffness, which in turn implies that the device’s performance is poised for swift improvement as the etching process advances.
However, the analysis reveals that the torsional stiffness, represented by kt, exhibits a mathematical similarity with the in-plane stiffness ky. Both stiffness parameters are linearly dependent on AR, as delineated by the proportional relationships kt ∝ AR ⋅ CD4 and ky ∝ AR ⋅ CD4 (refer to Eqs. (13) and (14)). This linear dependence engenders a situation wherein the out-of-plane stiffness kt and the in-plane stiffness ky exhibit analogous trends, despite the critical dimension CD decreasing and the aspect ratio AR increasing. Consequently, the improvement in device performance due to technological advancements may not be as significant as initially anticipated.
As shonw in Fig. 2a–d, it is apparent that within a reasonable span of structural dimensions, the values of kt/Wtot and kz_bend are of the same order of magnitude. This finding underscores the substantial impact of the torsional stiffness, quantified by kt/Wtot, on the overall out-of-plane stiffness of the device. Therefore, there is a clear necessity for the development of an innovative design methodology.
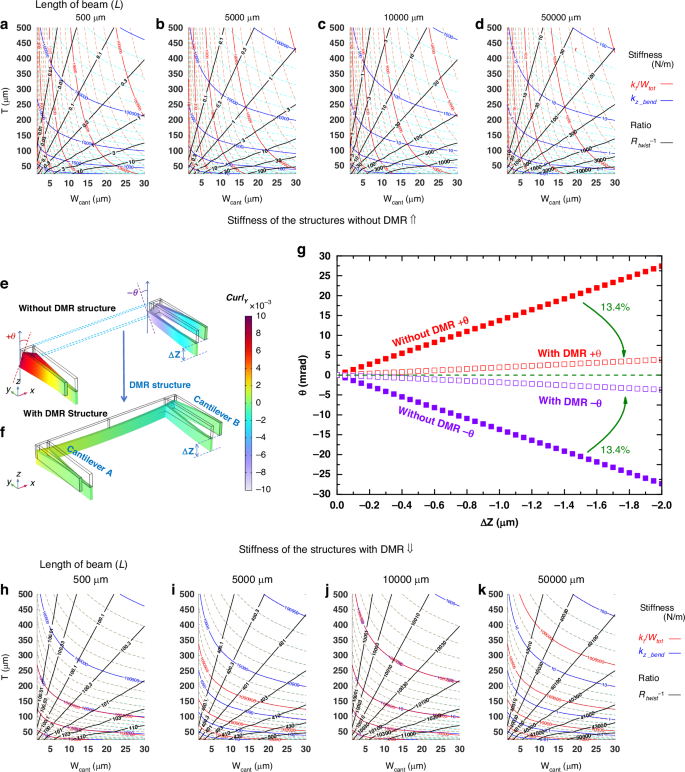
500 μm (a), 5000 μm (b), 10000 μm (c), and 50000 μm (d); visualization of torsional simulation results with and without the DMR structure (e); results of torsional suppression effects with and without the DMR structure (f); torsion angle comaprision of structures with/without DMR structures (g); theoretical calculations of in-plane stiffness and torsional stiffness as a function of cantilever beam dimensions for different lengths with the DMR structure: 500 μm (h), 5000 μm (i), 10000 μm (j), and 50000 μm (k)
A design method for boosting out-of-plane stiffness based on differential mode motion suppression
Figure 1b delineates the out-of-plane motion scenario, wherein beams A and B manifest torsional movements that, while being of the same amplitude, are directed in completely opposite ways. The quantification of this torsional movement is achieved through the mathematical operator CurlY, as articulated in Eq. (17). It describes the local rotational characteristics of a vector field in space. For the torsional motion of beams, the CurlY operator quantifies the angular displacement distribution induced by shear deformation through calculating the differential components of the displacement field along the Y-direction. Specifically, when two adjacent beams (e.g., A and B) exhibit opposite torsional directions, the curl values of their displacement fields demonstrate symmetric positive and negative spatial distributions, directly reflecting the dynamic equilibrium of counteracting torques within the system. CurlY is intrinsically linked to the internal shear stress tensor of the material: its magnitude characterizes the local density of torsional energy, while its sign indicates the rotational direction. Moreover, the torsional displacements at the summit of the cantilevers are designated by the angles θ and −θ, respectively, thereby underscoring the counter-directional nature of their rotational displacements, as shown in Fig. 2e.
$$Cur{l}_{Y}=\frac{\partial [\Delta X(x,y,z)]}{\partial z}-\frac{\partial [\Delta Z(x,y,z)]}{\partial x}$$
(17)
If the structure undergoes out-of-plane movement, a significant difference in rotational motion is observed at the bending points of beams A and B. To address this issue, an additional cantilever is integrated as a Differential Motion Rejection (DMR) structure, as illustrated in Fig. 2f, promoting a much more stable and rigid rotational response across the entire structure.
As depicted in Fig. 2g, the diagram presents the differential curvature observed in symmetrically bent beam structures under load in the Z-direction, along with the alleviating impact of DMR structures on this curvature. The beams are characterized by a structural thickness of 200 μm. The solid dots indicate the curvature variation with displacement in the absence of a DMR structure. Specifically, as beams A and B are subjected to incrementally increasing negative displacements along the Z-axis (ΔZ), the curvature angle θ at the bending point increases linearly. It is noteworthy that the magnitude of the curvature for both beams A and B are identical but with opposite signs. Upon the integration of the DMR structure, as indicated by hollow markers in Fig. 2g, the CurlY at the corresponding position is diminished by 86.6%, compared with the value observed in the structure without the DMR. The substantial reduction in curvature underscores the DMR structure’s efficacy in managing differential deformations under load conditions.
The contribution of the DMR structure to the overall stiffness is analyzed theoretically. Initially, it is observed that the two ends of beams A and B, which are connected by the DMR structure, undergo co-modal motion without relative displacement during in-plane movement, thus the DMR structure does not influence the overall in-plane stiffness of the device. Subsequently, in the context of off-plane movement, the deformation of the DMR structure conforms to Euler’s beam theory, as detailed in Eq. (18).
$$\omega^{\prime} (x)=\frac{Mx}{EI}+{C}_{0}$$
(18)
The length of the additional cantilever is 2L, and the differential rotation between beams A and B is imposed on the DMR structure as a rotational boundary condition, as illustrated in Eq. (19).
$$\left\{\begin{array}{llll}\omega^{\prime}(0)&=& -{\theta} & (a)\\ \omega^{\prime}(L_{DMR})&=&+{\theta} & (b)\end{array}\right.$$
(19)
combining Eqs. (18) and (19), one can get Eq. (20):
$$\frac{M}{\theta }=\frac{2EI}{{L}_{DMR}}$$
(20)
M/θ is also the expression form of torsional stiffness, so additional stiffness introduced by DMR structure, kt_add, is expressed by Eq. (21);
$${k}_{t\_add}=\frac{E{W}_{tot}{T}^{3}}{4L}$$
(21)
where, for ease of analysis, the length of the DMR structure LDMR, is replaced by 2L, twice the length of the cantilevers.
One can obtain a new torsion stiffness as
$$\frac{{k}_{t\_tot}}{{W}_{tot}}=\frac{{k}_{t}+{k}_{t\_add}}{{W}_{tot}}=\frac{G}{3L{W}_{tot}^{2}}T{W}^{3}+\frac{E}{4L{W}_{tot}^{2}}{T}^{3}W$$
(22)
The ratio between kt_add and kt as in Eq. (23)
$$\frac{{k}_{t\_add}}{{k}_{t}}=1.5(1+\nu )\cdot A{R}^{2}$$
(23)
where the additional stiffness is much larger than the original, kt_add ≫ kt, since the ratio between them is a square of AR, which refers to the aspect ratio of the process, and is usually higher than 20. As indicated in Eq. (23), the term kt can be considered negligible, allowing the total torsional stiffness kt_tot to be roughly expressed as the cube of AR, as shown in Eq. (24). This implies that the torsional stiffness increases dramatically with increasing aspect ratio of the process.
$$\frac{{k}_{t\_tot}}{{W}_{tot}}=\frac{E}{4L{W}_{tot}^{2}}\cdot A{R}^{4}\cdot C{D}^{3}$$
(24)
The expression of Rtwist is updated as Eq. (25), where kz_bend is given in Eq. (15), and kt_tot/Wtot is given in Eq. (24).
$${R}_{twist}=\frac{{k}_{z\_bend}}{{k}_{t\_tot}/{W}_{tot}}$$
(25)
The updated dependency of stiffness on size parameters are graphically represented in Fig. 2h–k. Upon comparing Fig. 2h–k with Fig. 2a–d, two distinctions are noticeable:
Initially, the influence coefficient (Rtwist-1, black lines) exhibits a significant increase in Fig. 2h–k, compared with that of Fig. 2a–d. In the elastic frame with the DMR structure, the reduction of the Rtwist indicates larger torsion stiffness and effective suppression of the supporting beam’s torsional motion. The previously mentioned compound motion of bending and torsion in the supporting beam approaches a pure out-of-plane bending, thereby increasing the out-of-plane stiffness of the elastic frame structure.
Secondly, the fluctuation patterns of the new torsional stiffness (kt_tot/Wtot, red lines) and the out-of-plane bending stiffness (kz_bend, blue lines) are nearly indistinguishable, so both kz_tot and kt_tot/Wtot are in direct proportion to AR3. This analysis indicates that, the out-of-plane stiffness of the elastic frame equipped with DMR architecture can experience boosting with the enhancement of the process aspect ratio. A key trend is demonstrated: the refinement of the MEMS manufacturing process persistently aids in the improvement of device performance.
Design and simulation
Design of the elastic frame
A practical two-degree-of-freedom (2-DOF) MEMS electromagnetic actuator is designed, based on the DMR structural design methodology, as shown in Fig. 3. The schematic layout of the actuator is depicted in the accompanying figure, which illustrates a central micromoving platform supported by two sets of support beams oriented along the X and Y axes. These beams facilitate the movement of the micro platform within the device.
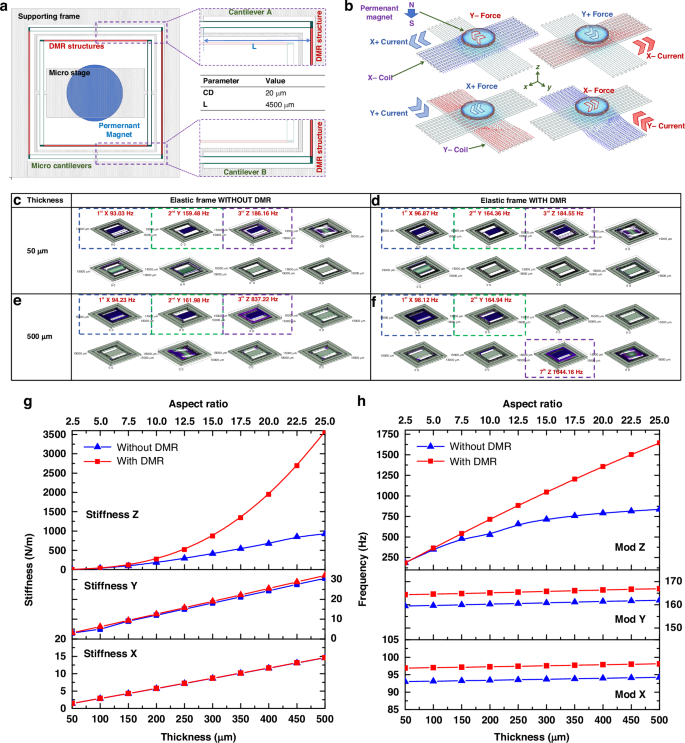
Schematic diagram of the layout design with DMR structure (a). Different driving forces can be applied by the currents in two sets of coils in different directions (b); Vibration modes in the X, Y, and Z directions of the actuator with DMR structure under thicknesses of 50 μm (c) and 500 μm (e), respectively; vibration modes in the X, Y, and Z directions of the actuator without DMR structure under thicknesses of 50 μm (d) and 500 μm (f), respectively; comparative stiffness diagram in the X, Y, and Z directions of the actuator with and without DMR structure (g); comparative vibration frequency diagram in the X, Y, and Z directions of the actuator with and without DMR structure (h)
As shown in Fig. 3a, one set of the beam structure is highlighted for clarity, corresponding to the reference Fig. 2f. The green-colored Cantilever A and Cantilever B, as well as the red-highlighted DMR structure, are clearly visible. The width of all green beam structures, denoted as CD, is specified to be 20 μm; the length L of the silicon beam is 4500 μm.
In Fig. 3b, two orthogonal coil structures, designated as X-Coil and Y-Coil, are positioned immediately beneath the actuator in the XY plane. The direction of the current flow is represented by large solid arrows, while the small solid arrows indicate the direction of the Ampere’s force acting on the interconnect structures. The force acting on the permanent magnet is equal in magnitude but opposite in direction to that on the interconnect structure. By precisely regulating the magnitude and direction of the current through the two sets of coils, the driving forces in the X and Y axes are controlled independently.
FEM static simulation
FEM simulation results are shown in Fig. 3g, which further illustrates the impact of DMR structure on the performance of MEMS actuators. The vertical axis represents the structural stiffness in different directions; the bottom horizontal axis represents the device thickness, and the top horizontal axis represents the corresponding AR for each thickness, with the device CD size of 20 µm. In Fig. 3g, the red curves are the stiffness simulation results of the silicon frame with the DMR structure, while the blue curves are the stiffness simulation results of the structure without the DMR structure, which is shown as red colored parts in Fig. 3a.
In Fig. 3g, it can be seen that, as the device thickness and AR increase, the in-plane (X/Y direction) stiffness of the elastic frame with/without the DMR structure increase linearly. The stiffness of the two structures are almost the same, indicating the DMR structure has little effect on the in-plane motion, which is dominated by the common-mode beam movement.
However, for the relationship between the out-of-plane stiffness and AR, the elastic silicon frames with/without the DMR structure exhibit different patterns: as AR continues to increase, the stiffness growth rate of the silicon frame without the DMR structure slows down, indicating the difficulty of converting process capability improvements into device performance being continuously increasing. In contrast, the out-of-plane stiffness of the silicon frame with the DMR structure keeps boosting rapidly with the increase of AR, converting the improvement in process capability into out-of-plane stiffness effectively. The performance difference between the elastic frames with/without the DMR structure also continuously goes up with the increasing AR. In other words, the effect of the DMR structure becomes more and more significant as the process progresses constantly.
FEM modal simulation
Upon examining Fig. 3c–f and h, it is possible to evaluate the modal impact of the DMR structure on the elastic frame structure’s performance. Figure 3c–f delineate the first eight modal shapes along with their respective frequencies for the configuration depicted in Fig. 3a, both in the presence and absence of the DMR structure, across thicknesses of 50 μm and 500 μm.
As shown in Fig. 3h, this analysis reveals that the in-plane modes, specifically the first and second modes, remaining largely unaffected by the incorporation of the DMR. The DMR structure exerts a negligible influence on the in-plane motion characteristics of the elastic frame structure.
The simulation outcomes are corroborated by the theoretical analysis presented in this paper, which posits that during the in-plane motion phase, the termini of the DMR structure exhibits a common-mode motion pattern. This implies the DMR structure remains undeformed in response to the in-plane X/Y directional movement of the elastic frame, consequently having no discernible impact on the in-plane X/Y directional motion of the elastic frame.
In contrast to the linear escalation of in-plane stiffness with thickness noted in static simulations, the in-plane resonant frequency exhibits minimal variation with changes in thickness. This discrepancy can be attributed to the fact that the resonant frequency is a function of the ratio of stiffness to mass. As the thickness is altered, both stiffness and mass change in tandem, thereby maintaining a constant ratio and resulting in a relatively invariant resonant frequency with respect to thickness variations.
The modal behavior along the Z-axis and the outcomes from static simulations are closely aligned, indicating that the out-of-plane motion modal frequency of the structure equipped with a DMR increases significantly with thickness, while the frequency for the structure without DMR rises at a much slower pace. Furthermore, as depicted in Fig. 3c–f, as thickness increases from 50 μm to 500 μm, the out-of-plane motion modal of the structure without DMR remains in the third vibration mode, whereas the modal of the structure with DMR transitions from the third to the seventh mode. This observation further substantiates the effectiveness of the DMR structure in enhancing the out-of-plane motion stiffness of the elastic frame and in suppressing detrimental out-of-plane motions.
Figure 4 systematically illustrates the simulated dynamic response characteristics of microstructures under varying preload acceleration and device thickness conditions. Figure 4a, b present comparative amplitude-frequency characteristic curves for devices with and without DMR configurations, respectively, demonstrating how their frequency responses evolve with increasing preload acceleration across different thickness parameters. The side-by-side comparison highlights the distinct vibration modulation capabilities imparted by the DMR architecture. Figure 4c quantitatively maps the coupled relationship between resonant peak behavior, preload acceleration, and device thickness, revealing while external loading exerts a profound impact on the mechanical resonance frequency in conventional structures, DMR configurations demonstrate a significant attenuation of such effects. Figure 4d further analyzes this interdependence through sensitivity metrics, contrasting the relative influence of preload acceleration on resonant frequency across multiple thickness configurations. This comprehensive visualization framework not only decouples the competing effects of structural geometry and operational loading, but also provides essential guidelines for optimizing device robustness in acceleration-sensitive applications.
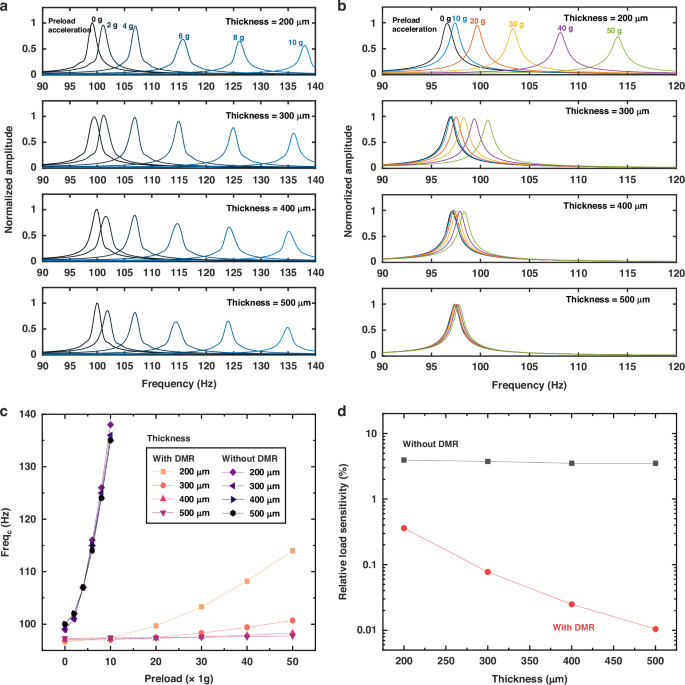
Comparative diagrams of amplitude-frequency characteristic curves versus device thickness for structures (a) without and (b) with DMR configurations; c dependence relationship plot of device resonant peak on preload acceleration and device thickness; d relative load sensitivity comparison diagram of resonant frequency to preload acceleration under varying thickness conditions
In Fig. 4d, the relative sensitivity metric quantifies the susceptibility of device dynamic characteristics to external loads, defined as the ratio of the relative frequency variation rate to the applied load magnitude. For devices with and without DMR configurations, the relative sensitivity formulations are explicitly expressed in Eq. (26), where MaxLoad is 50 g (or 490 m/s2) for the structure with DMR, and 10g (or 98 m/s2) for the structure without DMR, respectively.
$$\,{\rm{Relative}}\, {\rm{Load}}\, {\rm{Sensitivy}}\,=\frac{Fra{q}_{C}(MaxLoad)-Fra{q}_{C}(0)}{MaxLoad\times Fra{q}_{C}(0)}\times 100 \%$$
(26)
The comparative analysis in Fig. 4 demonstrates the significant advantages of devices with integrated DMR structures in load sensitivity. Compared to conventional configurations, DMR-equipped devices exhibit 90.8% (3.93% → 0.36%) to 99.7% (3.50% → 0.01%) reduced sensitivity of resonant frequency to external loads, with this difference maintaining stable trends across the 200–500 μm thickness range. Notably, while preserving identical layout structures, the load sensitivity of DMR configurations displays nonlinear attenuation characteristics as device thickness increases, showing a negative correlation between sensitivity coefficients and thickness parameters. This implies that advancements in micromachining processes enabling thicker structural layers (e.g., transitioning from the current mainstream of 200 μm to the next generation of 500 μm) would yield additional 97.2% shinkage (0.36% for 200 μm → 0.01% for 500 μm) in environmental robustness for DMR devices. In stark contrast, non-DMR structures exhibited merely 11% fluctuations in load sensitivity across the same thickness range, indicating their mechanical responses remain essentially unaffected by geometric scaling parameters.
Fabrication
The sequence of operations for the test sample is depicted in Fig. 5a–f, the sample photos are shown in Fig. 5g–i. The process begins with the following steps:
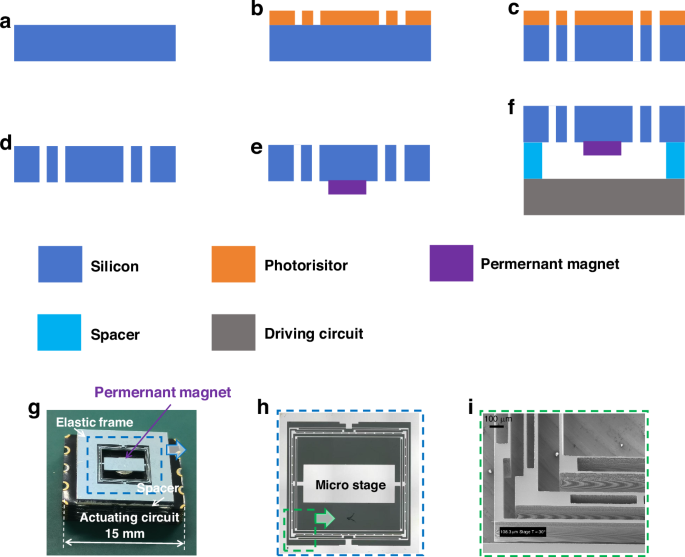
a–f Micro-nanofabrication steps of the MEMS actuator; (g–i) Optical images and micro-nanostructure diagrams of the MEMS actuator
(a) Silicon Wafer Preparation: Commence by procuring a four-inch diameter silicon wafer that has a uniform thickness of 200 micrometers. This wafer will serve as the foundational material for the subsequent steps.
(b) Lithography: Subsequently, employ photolithography to transfer the design of the elastic silicon frame onto the wafer surface. This process entails coating the wafer with a photosensitive resist, exposing it to light through a mask containing the desired pattern, and developing the resist to produce a precise structural pattern on the wafer. Detailed process parameters are shown in Table 2.
(c) Deep Silicon Etch: Next, utilize deep silicon etching techniques to precisely etch through the full thickness of the silicon wafer, adhering to the pattern defined in the previous step. This step is crucial for achieving the detailed geometry of the elastic frame with high accuracy, detailed process parameters are shown in Table 3.
(d) Photoresist Removal: After completing the etching process, remove the photoresist layer used to protect the unetched regions. This step exposes the fully defined and etched movable structure of the silicon frame, ensuring it is ready for subsequent processing stages.
(e) Movable Structure Release: With the photoresist removed, the movable structure of the silicon frame is now fully released and can be carefully manipulated for the assembly process as needed.
(f) Magnet Attachment: Attach a permanent magnet to the elastic silicon frame structure. This magnet is essential for the device’s operation, as it generates the magnetic field required for its functionality.
(g) Assembly with Spacer and Driving Circuit: Finally, the MEMS actuator is completed by bonding the elastic silicon frame structure, which now incorporates the permanent magnet, to a spacer made from BF33 glass. This spacer has been precisely cut using a laser cutting technique to ensure an accurate fit and optimal performance. In addition to the spacer, the elastic silicon frame structure is also bonded to the driving circuit, which is mounted on a PCB with an FR4 substrate. The driving circuit is crucial for powering and controlling the operation of the device.
Experiment
The actual prepared MEMS actuator samples along with their in-plane motion testing environment are depicted in Fig. 6a. The integrated samples are carefully positioned on the microscope stage, enabling precise observation and analysis under high magnification. For static stroke testing, the device is actuated by a DC voltage provided by the power supply, and the microscope captures the image of the sample’s micro-movement platform, which is projected in real-time onto a monitor, providing a visual feed that can be continuously observed and recorded during the testing process; for dynamic stroke characterization, the micro-stage was driven by a signal generator, while a stroboscopic imaging system integrated into the microscope enabled precise tracking of its positional changes.
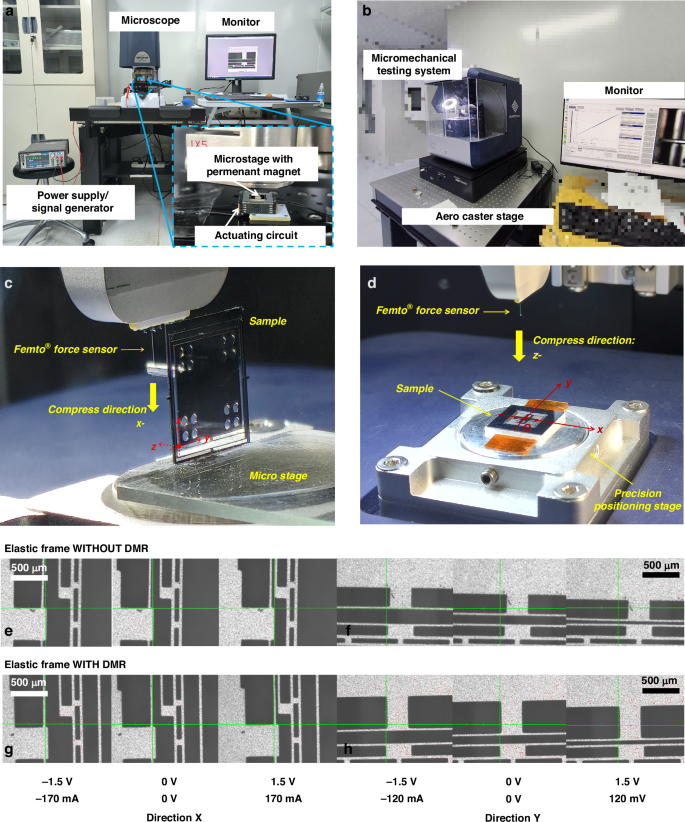
Schematic of the in-plane stroke testing (a) and stiffness testing (b) environment for the MEMS actuator; setup of the in-plane (c) and out-of-plane (d) stiffness testing environment; optical images of actuator motion without the DMR structure under driving voltages of −1.5, 0, and 1.5 V in the X-direction (e) and Y-direction (f); optical images of actuator motion with the DMR structure under driving voltages of −1.5, 0, and 1.5 V in the X-direction (g) and Y-direction (h)
The driving circuit, an integral part of the system, is connected to a power supply in static experiments. The circuit is fabricated with a specific conduction resistance of 8.9 Ω for X-Coil (provides the driving force in the Y-direction) and 12.5 Ω for Y-Coil (provides the driving force in the X-direction). The choice of the appropriate coil dictates the direction of the driving force along the X or Y axes of the platform. This precise directional control is enabled by the deliberate placement and optimized configuration of the coils within the system.
Under quasi-static conditions, which refer to a state where the system is not subject to rapid changes or dynamic forces, the driving force can be finely tuned. By adjusting the polarity and magnitude of the power supply voltage, the current that flows through the drive circuit is controlled linearly. The linear control over the current is essential for precise manipulation of the micro-movement platform. The polarity and magnitude of the driving force are intrinsically linked to the current. By regulating the current, both the direction and the intensity of the force applied to the platform are precisely controlled, enabling accurate and adaptable operation.
The test images for the in-plane motion of the MEMS actuator are shown in Fig. 6c–f, and the test results are shown in Fig. 7a, b. The horizontal axis represents the driving voltage and the corresponding driving current, while the vertical axis represents the displacement in the X (Fig. 7a) or Y (Fig. 7b) direction. The solid dots are the experimental data obtained from the tests, the solid line at the center of the shaded area is the expected curve from the linear fitting of the experimental data, and the shaded area represents its confidence interval. The main parameters of the experimental data fitting work are listed as well.
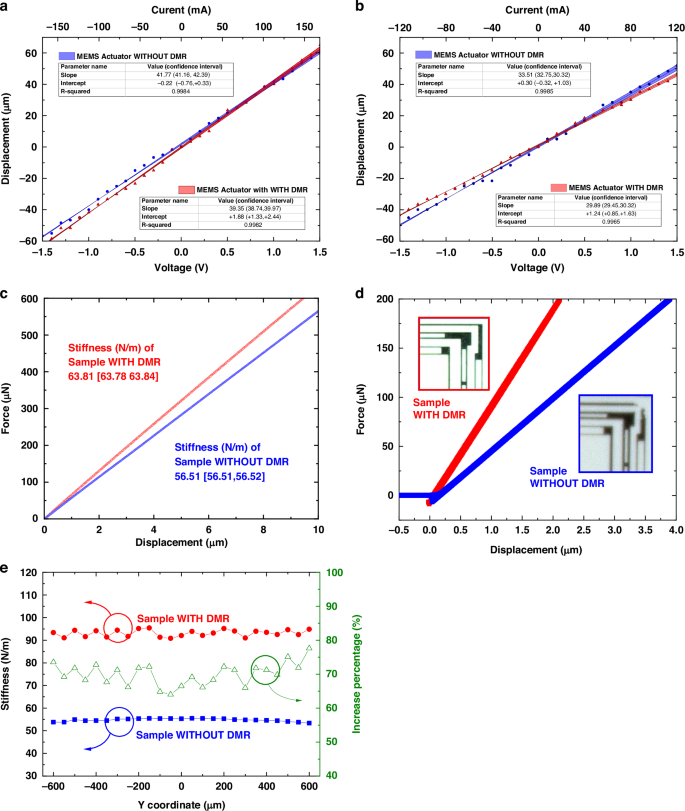
Stroke test results of the actuator in the X-direction. a and Y-direction (b); in-plane (c) and out-of-plane (d) stiffness test results of the actuator; additional out-of-plane stiffness under different Y coordinates on the micro-motion platform of the MEMS elastic frame with/without the DMR structure (e)
Analyzing the curves of in-plane driving voltage and displacement of MEMS actuators leads to the conclusion: (1) There is a good linear relationship between the actuator displacement and the driving voltage/current, indicating that the stiffness of the elastic frame remains stable throughout the entire stroke. Good stiffness stability is beneficial for the actuator to achieve precise positioning. (2) The motion stiffness of actuators with and without the DMR structure in the same in-plane direction is very close, suggesting that the impact of the DMR structure on the in-plane stiffness of the device is smaller than the test error.
The stiffness along the Z-axis of the elastic frame is measured using a micro-nano mechanical force sensor. The experimental setup is shown in Fig. 6b, where the elastic frame structure of the MEMS actuator is placed on the micro-motion base of the device.
As shown in Fig. 6c and d, construct a Cartesian coordinate system with the sample center, with the directions of the X, Y, and Z axes marked on the diagram. The tip of the force sensor points in the mentioned directions (negative direction of the X and Z-axis) and applies a defined force to different positions of the device’s micro-motion platform, and records the displacement along with the directions of force. Through these data, researchers are able to calculate the stiffness of the elastic frame in the Z-axis direction, thereby gaining a more comprehensive and in-depth understanding of the mechanical performance of the MEMS actuator.
To ensure the accuracy of the test results, the out-of-plane stiffness of both the with and without DMR structures are completed on the same sample. First, the stiffness of the device with DMR structure is tested, then the DMR structure is trimmed using a laser to obtain the device without DMR structure, and comparative tests are conducted. The laser trimming process is conducted at the Institute of Microelectronics, Chinese Academy of Sciences, utilizing ultrafast laser processing technology to achieve a minimized heat-affected zone29, enabling precise severing of device structures without impacting adjacent regions. Detailed process parameters are summarized in Table 4, and a representative micrograph of a standardized sample is shown in Fig. 8.
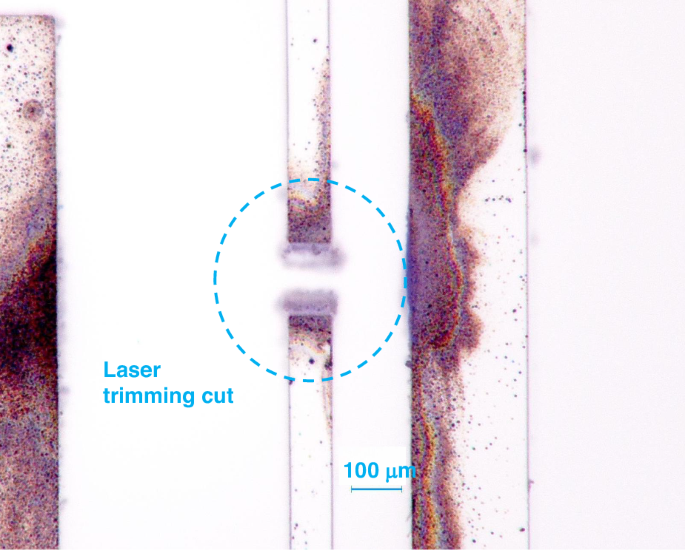
Micrograph of laser trimming cut
Figure 7c is the in-plane, while Fig. 7d, e are the test results of the out-of-plane stiffness test. Figure 7d shows the displacement-force test curves for the elastic frame with and without DMR, with the force applied at the geometric center point “O” of the elastic frame.
As shown in Figs. 6d and 7d, during the testing process, the tip of the force sensor is controlled by the host computer through a micro-nano mechanical probe, gradually descending to make contact with the surface of the elastic frame and gradually applying a load up to 200 μN. The instrument records the displacement corresponding to each point, thereby obtaining a displacement-force curve, with displacement as the X-axis and force as the Y-axis. According to Hooke’s Law, within the elastic deformation phase, this curve is a straight line, it’s slope is the out-of-plane stiffness of the structure.
In Fig. 7d, the difference in out-of-plane stiffness between the elastic frame structures with and without DMR are observed through the comparison of the red and blue curves. Under the same condition of applying a 200 μN load, the displacement of the structure with DMR is 2.2 μm, whereas the displacement of the structure without DMR is 3.7 μm. In other words, the out-of-plane stiffness of the structure with DMR is 91 N/m, while the out-of-plane stiffness of the structure without DMR is 54 N/m. The out-of-plane stiffness of the structure with DMR is 68.5% higher than that of the structure without DMR.
MEMS actuators carry different types of loads on their micro-motion platforms according to the needs of application, and the position of the load’s center of gravity also changes with different applications. Therefore, the stability of the out-of-plane stiffness of MEMS actuators under varying load application positions is very important. Figure 7e shows the stiffness measured under different Y coordinates on the micro-motion platform of the MEMS elastic frame, with the definition of the Y coordinate as shown in Fig. 6b. From Fig. 7e, it can be seen that the stiffness variation of the MEMS actuator elastic frame with a DMR structure when loaded at different positions in the Y direction is not more than 5 N/m, which is within 6% of the total stiffness (91 N/m), demonstrating good stiffness stability and platform torsion suppression capability.
By comparing the blue and red stiffness curves in Fig. 7e, the change in out-of-plane stiffness of the MEMS actuator elastic frame with/without the DMR structure at various test points on the Y-axis can be determined, as represented by the green line in the figure. In Fig. 7e, it is evident that under loading conditions at different Y-axis coordinate positions, the out-of-plane stiffness of the actuator elastic structure with DMR is over 60% higher than that of structures without DMR, further demonstrating the DMR structure’s effectiveness in enhancing out-of-plane stiffness and suppressing out-of-plane motion.
This study systematically verifies the dynamic stability and durability of actuators with DMR structures under large-deformation repetitive loading conditions. As shown in Fig. 9, to characterize device performance under extreme mechanical loads, a prototype of the actuator featuring large stroke is specifically designed and fabricated. The device is driven by a signal generator that precisely locked its operating frequency at the resonant point during an 8-h continuous dynamic loading experiment. A frequency scanning strategy was implemented, conducting broadband frequency sweep tests (87–107 Hz, 20 Hz bandwidth) at initial (0 h), intermediate (2 h, 4 h), and final (8 h) stages. Displacement response data were synchronously recorded to construct amplitude-frequency characteristic curves. Utilizing the Lorentzian function model, as shown in Eq. (27), nonlinear Least Squares Fitting is performed on experimental data to extract critical parameters including amplitude (Amax), full width at half maximum (FWHM), and center frequency (FreqC), along with their statistical confidence intervals.
$$A(f)={A}_{max}\frac{{(FWHM/2)}^{2}}{{(f-Fre{q}_{C})}^{2}+{(FWHM/2)}^{2}}$$
(27)
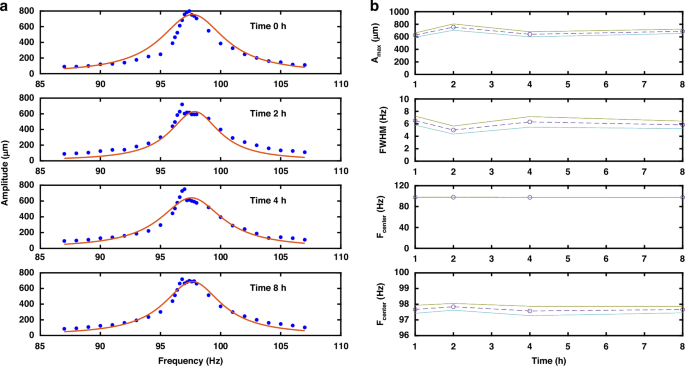
Frequency response characteristics under dynamic stroke aging test (a), time-evolution of critical frequency domain parameters (b)
Experimental results demonstrate remarkable mechanical stability. Under large-stroke dynamic loading with 800 μm peak-to-peak amplitude (± 400 μm), the initial resonant frequency stabilized at 96.7 Hz, accompanied by an FWHM of 6.51 Hz, yielding a quality factor (Q) of 14.8 in atmospheric conditions. Notably, during 2.78 million loading cycles, the resonant center frequency exhibited minimal drift—the maximum deviation of 0.17 Hz (relative variation of 1.7‰) occurred at the 2h mark, while the cumulative frequency shift after 8 h measured merely 0.01 Hz (97.67 Hz→97.66 Hz, relative variation of 0.1‰). The low frequency drift, combined with stable amplitude characteristics throughout the testing period, confirm the mechanical integrity of the DMR structure under cyclic large-deformation loading. These findings highlight its exceptional fatigue resistance and long-term operational reliability in demanding mechanical environments.
link


