Displacement-based seismic fragility assessment of a high-rise reinforced concrete building
Linear analysis
The linear analysis methodology in this study involves the modelling and analysis of a G+19 asymmetric RC structure using ETABS software. The building is designed with vertical, planar, and mass irregularities, and the floor plan changes at every fifth level. The analysis begins by creating a three-dimensional model, with the material properties and frame section details (columns, beams, slabs) assigned as per the specifications provided in the design tables.
The dead and live loads are applied based on IS 875 (Part 1 and 2), with wall loads assigned as distributed loads on beams and floor loads applied as uniform shell loads on slabs. The self-weight of the structure is included using a self-weight multiplier of 1.0. A rigid diaphragm is assumed at each floor level to simulate in-plane rigidity (Table 4). The mass source is defined, and response spectrum load cases (RSX, RSY, and RSZ) are created for seismic analysis.
The linear static analysis uses the Response Spectrum Method as per IS 1893 (Part 1): 2016. The base shear forces in both X and Y directions are calculated and verified against code-specified values to ensure accuracy. Appropriate load combinations, including dead, live, and seismic loads, are defined according to the IS 1893:2016 standards.
After running the linear analysis, primary structural responses such as base shear, displacements, and story drifts are extracted and assessed. This forms the foundational step before proceeding to nonlinear static and dynamic analyses. The purpose of this phase is to verify the adequacy of the structural design under code-specified seismic loads and to ensure compliance with Indian seismic design standards. This linear assessment also helps identify potential vulnerabilities and validate the structural configuration before introducing nonlinear behaviours in further stages of the research.
Nonlinear static analysis
The nonlinear static analysis of the G+19 asymmetric RCC structure was performed after completing the linear analysis using ETABS. Gravity loads were first assigned, and P-Delta geometric nonlinearity was activated to account for second-order effects. Hinges were applied to structural elements to capture inelastic behaviour: beams were assigned “Auto Hinge Type” with M3 rotational hinges at both ends, while columns were assigned hinges based on ASCE 41-17 with “P-M2-M3” degrees of freedom. These hinges simulate potential plastic deformations under increasing lateral load. The model was saved and evaluated to confirm the hinge assignments and structural response.
This procedure enables the identification of failure zones and progressive deformation patterns under static lateral loading. The nonlinear static (pushover) analysis helped understand the sequence of plastic hinge formations and their locations, providing essential insights into the structural capacity and potential collapse mechanisms under seismic loading scenarios.
Nonlinear dynamic analysis
The nonlinear dynamic analysis in this study was conducted using time history analysis to simulate the real-time seismic response of a G+19 asymmetric RC structure. This approach involved applying 44 pairs of earthquake ground motion records sourced from FEMA P695. These records were selected to represent a wide range of seismic intensities and soil conditions, and they were scaled incrementally until structural collapse occurred. Compatibility between time history and response spectrum data was ensured using SeismoMatch software, which adjusted ground motion records to match the target spectrum.
The analysis incorporated P-Delta geometric nonlinearity and used the nonlinear direct integration method in ETABS. Nonlinear hinge properties were assigned to frame elements: auto-generated M3 hinges for beams and P-M2-M3 hinges (ASCE 41-17) for columns. These hinges capture inelastic behaviour, such as yielding and plastic deformations23. For each earthquake record, the structure was analyzed under increasing intensity until a collapse mechanism was identified through the formation of collapse hinges.
Inter-storey drift ratios (IDR%) (Eq. 1) were computed from the displacements of adjacent floors, serving as performance indicators. These were compared against predefined thresholds for Immediate Occupancy (IO), Life Safety (LS), and Collapse Prevention (CP). The resulting IDR values at different Peak Ground Accelerations (PGAs) were used to generate Incremental Dynamic Analysis (IDA) curves, which illustrate the structure’s deformation behaviour under varying seismic intensities.
$$IDR, \%=\frac{Upper storey displacement-Lower storey displacement}{Floor to floor height}*100$$
(1)
In this study, performance levels are classified based on inter-storey drift ratio (IDR) thresholds following Kircil & Polat11 and ASCE 41-17 criteria. The limits are explicitly defined as: Immediate Occupancy (IO: IDR ≤ 0.5%), Life Safety (LS: 0.5% < IDR ≤ 0.8%), and Collapse Prevention (CP: IDR > 0.8%). From the Incremental Dynamic Analysis (IDA) results, these thresholds correspond approximately to PGA ≤ 0.24 g for IO, PGA ≈ 0.30–0.42 g for LS, and PGA ≥ 0.54 g for CP. These values were adopted to construct fragility curves and assess the seismic vulnerability of the studied structure.
For each ground motion set, the PGA at which the collapse hinge formed was recorded. These collapse points were statistically analyzed to derive the mean and standard deviation of the logarithmic PGA values. Using this data, fragility curves were constructed to express the probability of structural collapse as a function of PGA. This probabilistic representation enhances the understanding of seismic vulnerability and supports performance-based design, risk mitigation, and retrofitting strategies for high-rise RCC buildings in seismically active zones.
To ensure robustness of the modeling framework, a representative subset of nonlinear time history analyses was also repeated in the open-source platform SeismoStruct24. The inter-storey drift ratios and collapse PGA levels obtained were in close agreement with those from ETABS, with differences generally within 5–10%. This cross-validation confirms that the displacement-based fragility assessment framework is not limited to a single commercial tool and can be reliably reproduced using open-source modeling environments.
Building modelling
Ground motion selection and spectrum compatibility
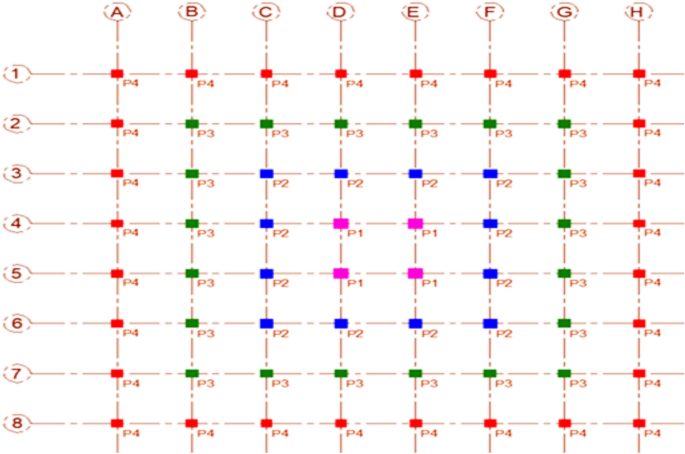
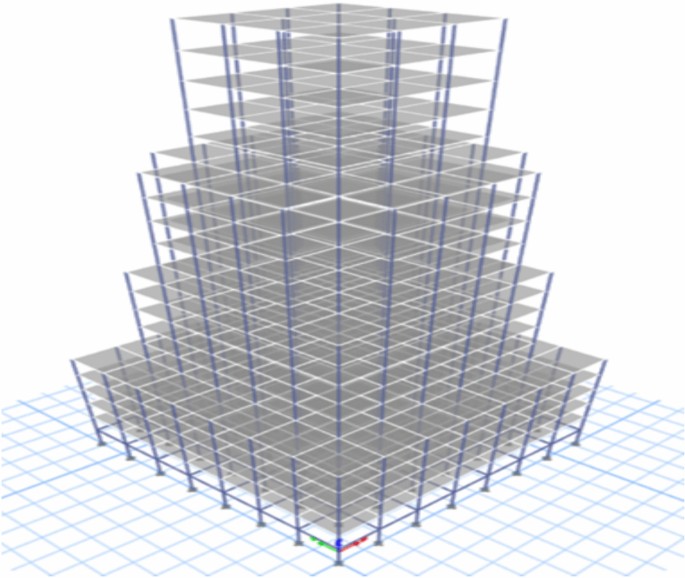
The building model considered in this study is a G+19 reinforced cement concrete (RCC) high-rise structure exhibiting both plan and vertical irregularities to reflect realistic seismic design challenges. The total structural height is 60.6 m, with a uniform storey height of 3.0 m, and a plinth level elevated 0.6 m above the ground. The design intentionally incorporates plan modifications at every fifth storey to induce torsional effects and to capture the influence of mass and stiffness irregularities on seismic performance. Figs. 1, 2, 3, 4, 5, 6 and 7 illustrate the structural configuration, including the grid layout (Fig. 1), three-dimensional perspective (Fig. 2), and plan views of the ground floor (Fig. 3), lower storeys (Figs. 4 and 5), middle storeys (Fig. 6), and upper storeys (Fig. 7).

Grid view of the building
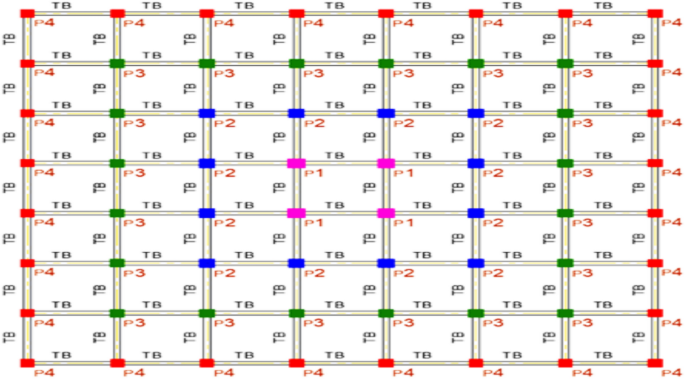
Plan view of the ground floor
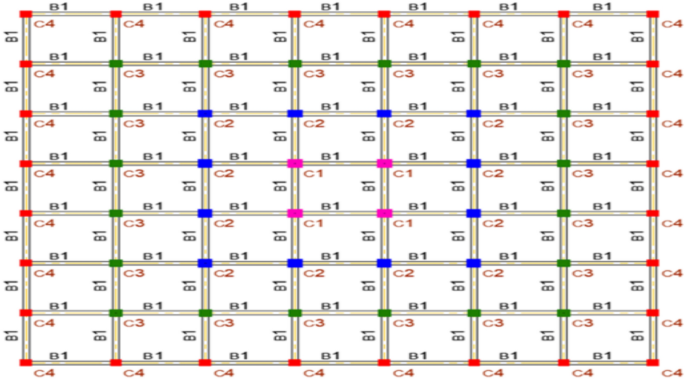
Plan view of 1st to 4th floor
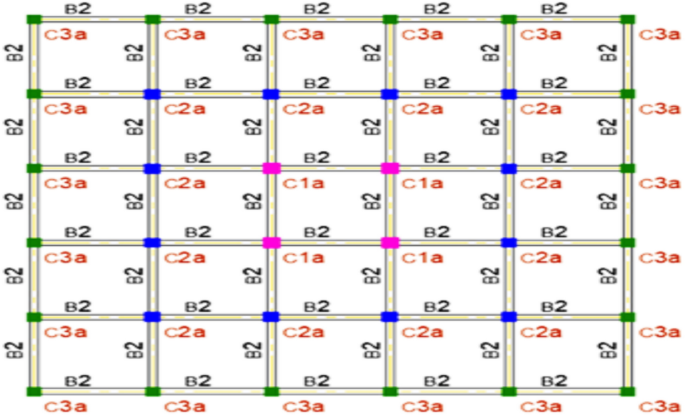
Plan view of 5th to 9th floor
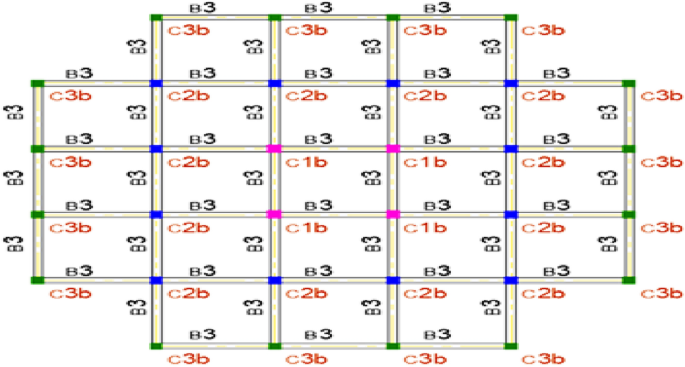
Plan view of 10th to 14th floor
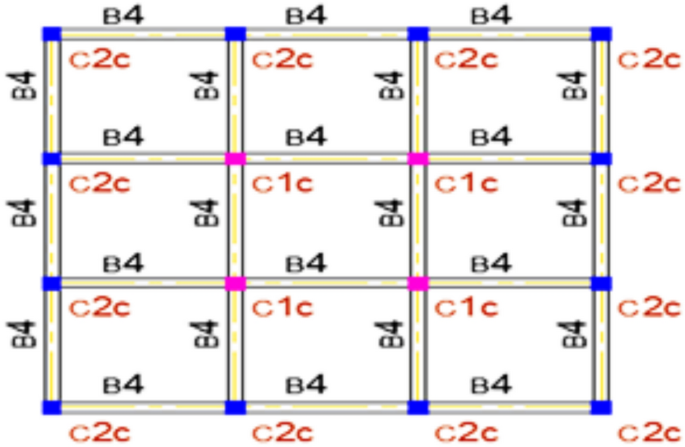
Plan view of 15th to 19th floor
The nonlinear dynamic analysis in this study employed 44 ground motion records obtained from FEMA P695, representing a broad range of magnitudes, source-to-site distances, and frequency content. Each record was scaled incrementally until collapse was observed in the structural model, ensuring that the entire spectrum of seismic demand was captured.
To maintain consistency with Indian seismic code requirements, spectrum compatibility was ensured between the selected records and the target design response spectrum for Zone III conditions. This was achieved using the SeismoMatch software, which adjusts the frequency content of raw ground motions to closely align with the target spectrum while preserving essential characteristics such as duration, phase, and peak values. The compatibility validation confirmed that scaled records retained realistic dynamic features, enabling reliable simulation of the building’s response under seismic loading.
By combining ground motion selection, incremental scaling, and spectrum compatibility in a single unified process, the methodology provides a robust basis for conducting Incremental Dynamic Analysis (IDA) and developing fragility curves.
SeismoMatch is a crucial instrument utilised to assess the compatibility of ground motions with a target response spectrum, an essential component of seismic analysis and design. Compatibility is essential for accurately incorporating seismic needs into design codes or site-specific analyses. SeismoMatch processes unrefined ground motion records while simultaneously modifying their frequency content. The response spectra are subsequently adjusted to closely align with the goal spectrum. Modifications are implemented using a wavelet-based technique that preserves intrinsic properties, including natural duration, phase, and peak values. This technique is iteratively performed until the modified ground motion aligns with the tolerance level of the target spectrum, so rendering it a realistic and dependable input for dynamic analysis. This is especially advantageous for managing varied ground motions, since users can analyse many records in a single session, hence enhancing efficiency in generating a set of spectrum-compatible motions. SeismoMatch provides engineers with powerful tools for evaluating structural responses and creating secure, resilient structures. This software enhances the use of ground motions, whether derived from natural records, synthetic motions, or scaled events, and guarantees dependable seismic performance.
Material properties and sectional details
Material grades and sectional properties of the structural elements are defined to comply with Indian Standard (IS) codes. The columns, beams, and slabs are dimensioned based on storey level to optimize strength distribution and stiffness requirements (Table 1 and Table 2). For instance, foundation columns (P1–P4) range from 850 × 850 mm to 700 × 700 mm, while top-storey columns (C1c, C2c) are reduced to 400 × 400 mm to balance load demands with reduced axial forces. Beam depths vary between 450 mm and 500 mm, and slab thickness is maintained uniformly at 150 mm across all floors. The material parameters, including M30 grade concrete, Fe500 grade steel, unit weights, and elastic moduli, are summarized in Table 3.
Load considerations
All gravity and live loads are assigned according to IS 875 (Part 1 and Part 2) provisions. Dead loads include the self-weight of structural members, wall loads (external: 13.6 kN/m, internal: 7.4 kN/m, parapet: 2.5 kN/m), and floor finishes (1.0 kN/m2 for typical floors, 2.4 kN/m2 for the terrace). Live loads of 3.0 kN/m2 are uniformly distributed on typical floors, while terrace floors have reduced live loading per code specifications (Table 4). The seismic parameters adopted in this study, summarized in Table 5, were defined in accordance with IS 1893 (Part 1): 2016. These parameters form the basis for the response spectrum analysis and ensure consistency with the seismic design requirements of Zone III conditions.
Modelling approach in ETABS
The structural model is developed in ETABS with careful definition of all material, section, and loading properties. A rigid diaphragm constraint is assigned at each floor to simulate in-plane stiffness of slabs, ensuring accurate distribution of lateral loads. The mass source includes dead loads and appropriate percentages of live loads to represent seismic mass. Response spectrum load cases (RSX, RSY, RSZ) are generated using the target design spectrum for Zone III.
Boundary conditions are fixed at the base to represent a fully restrained foundation, and static supports are applied in the vertical direction. The self-weight multiplier is set to 1.0 to ensure accurate gravity load simulation.
link


