Structural design and temperature control enabling high sensitivity nanomaterial-based three-electrode gas sensors
Simulation analysis and their implication
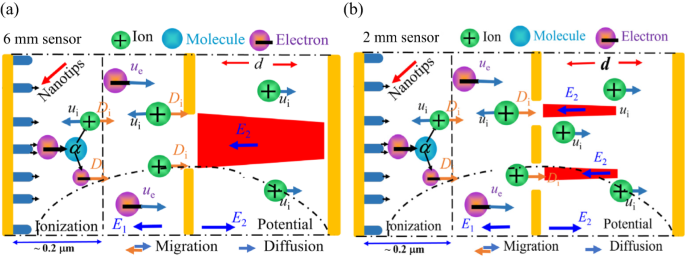
Two-dimensional schematic and simulation models for distant structures are depicted in Fig. 2. Under the conditions of Ue = 120 V, Uc = 10 V, and d = 120 μm, the analysis revealed a uniform longitudinal electric field, Ez, along each line Ez = 0, which acts as a demarcation between two regions. Above this line (where Ez > 0), the reverse electric field (E1) promotes the movement of positive ions towards the collecting electrode. Conversely, below this line (where Ez < 0), the positive electric field (E2) impedes this movement, as illustrated in Fig. 3, Supplementary Fig. S3 and Table 2, for the width direction and the length direction electric field distribution. By applying these longitudinal electric field assumptions, we investigated the impact of electrode structure on sensor performance. The results of this investigation are presented in Table 2 and have been experimentally validated.
To validate the fluid model, we applied boundary conditions to a 6 mm sensor and used ionization energies of gases (Table 1) to calculate collector current densities for CO and CH4 at different concentrations, temperatures, and supply voltages, as shown in Table 4. The experimental and simulation results for both gases showed consistent trends across different conditions, confirming the fluid model’s accuracy in measuring gas concentrations.
Effects of electrodes structure on sensor performance
The two-dimensional electrostatic field simulations result for the sensors are illustrated in Fig. 3 and S2, reveal distinct patterns in the width and length directions. For the 6 mm sensor (Fig. 3a), the E1 is absent at the center of the extraction hole and at the center of the collecting electrode. In contrast, the 2 mm sensor structure exhibits a small central region without E1 on the extracting electrode, but E1 is present across the entire collecting electrode (Fig. 3b). These findings are supported by the length-direction simulation results in Fig. S2B and summarized in Table 2. Additionally, the 2 mm sensor has an average current density approximately 3.3 times higher than that of the 6 mm sensor (see Fig. S3). Furthermore, the cation density at the cathode carbon tube in line 2 is significantly lower than in line 1 (see Fig. S4), indicating that a higher reverse electric field strength correlates with increased collecting and cathode current densities.
To validate the simulation results, we tested the gas ionization properties of three-electrode structures. We measured the current (Ic) for C2H2 gas flowing through Φ = 6 mm and Φ = 2 mm diffusion aperture sensors, using carbon nanotubes (CNTs) as the cathode material. At 30 °C, 90 V of Ue, 10 V of Uc, and d of 120 μm, the Ic of the Φ = 2 mm sensor declined from 15.02 nA to 5.9 nA as C2H2 concentration increased from 0 to 80 ppm (Fig. 4a). Conversely, the Φ = 6 mm sensor showed a slightly lower current, consistent with our simulation results (Fig. 1b). The reverse electric field (E1) in the Φ = 2 mm sensor significantly accelerated positive ions, resulting in a higher collecting current.
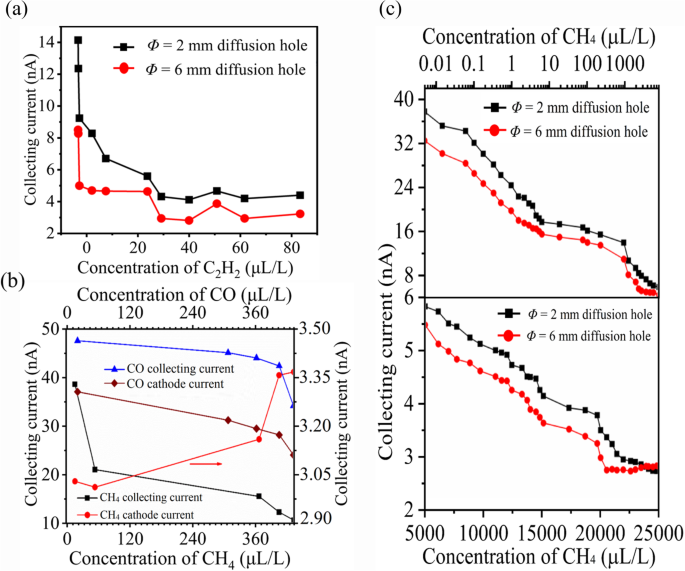
Experimental verification of influence of electrode structure. (a) In case of Φ = 2 mm sensor, the positive ionic current decreases in a single-value with increasing C2H2 concentration at d = 120 μm, 90 V Ue, 10 V Uc and 30°C, In contrasts with the multi-value decrease in ionic current under the same conditions for the Φ = 6 mm sensor (red). (b) The comparison of the cathodic and positive ionic current collection for the Φ = 2 mm sensor. At 95 μm electrode spacing, 50°C, and 80 V Ue. With the increase of CO and CH4 concentration, the average single values of collected current and cathodic current decrease however, the positive ionic collected current is approximately 1.1 ~ 1.5 times higher than the cathodic current for both gases. (c) The sensitivity characteristics comparison the of Φ = 6 mm and Φ = 2 mm sensors having CNTs with 150 nm thick gold film cathodes. At 75 μm electrode spacing, 30°C, and 120 V Ue, the Φ = 6 mm sensor exhibits multi-value sensitivity to CH4 gas (red), while the collected current decreases in a single value with the increase of CH4 concentration (black) for the Φ = 2 mm sensor.
The ionization sensor selectively extracts approximately ~ 1/3 of positive ions, enabling operation in non-self-sustained discharges11. Experiments with CO and CH4 gases evaluated cathode current and positive ion collection efficacy in our optimized sensor structure. Under conditions of 50 °C, 75 V Ue, 10 V Uc, and 100 μm spacing, we observed an inverse relationship between increasing CO concentration (Fig. 4b) and reductions in collecting and cathode currents. At 0 µL/L CO in N2, Ic was 49.36 nA and Icathode was 43.67 nA. The collected current consistently exceeded the cathode current by a factor of ~ 1.1 to 1.5. Under conditions of 40 °C, 90 V Ue, 10 V Uc, and 120 μm spacing, the CH4 sensor showed similar behavior. At 0 µL/L CH4, Icwas 60.33 nA and cathode current 7.814 nA, revealing a significant disparity. The 2 mm sensor’s collected positive ion current was ~ 1/2 ~ 2/3 times higher than the 6 mm sensor’s total discharge current11,14, aligning with our results in Fig. S3B (cathode current density). A sensitivity test evaluated two sensor structures detecting trace CH4 concentrations using gold-coated CNTs cathodes. At 30 °C, 120 V Ue, and 75 μm spacing, the Φ = 2 mm sensor is collecting current decreased from 42.90 nA to 3.90 nA as CH4 concentration increased from 0.01 µL/L to 20,000 µL/L (Fig. 4c). The Φ = 6 mm sensor showed consistently lower current with a multi-value decrease trend. These findings validate the sensing mechanisms, demonstrating that smaller aperture size enhances the reverse electric field, improving positive ion collection and reducing ion bombardment in the Φ = 2 mm sensor.
Reduced aperture diameter enhances sensor performance. We developed eight distinct structures (Supplementary Fig. S5) and measured their collecting current densities and ionization characterization under conditions of d = 120 μm, Ue = 120 V, and Uc = 10 V in pure N2. The Φ = 1.2 × 9 mm configuration consistently showed higher collecting current density (jc) at 1.10 × 10⁻³ A∙m−2 compared to Φ = 6 mm and Φ = 2 × 6 mm structures (Table 3). Simulations and experiments confirm that the small diffusion aperture (sensor 7) (Φ = 1.2 mm sensor, Fig. S1B) enhances positive ion collection, improving sensor performance.
Effects of discharge characteristics of cathode material on sensor performance
Cathode materials in ionization gas sensors inherently facilitate the efficient convergence of electric fields, but are heavily bombarded with positive ions, leading to material damage and reduced sensor performance and lifespan11–17. To address this, we studied the sensor’s discharge characteristics using a fluid model (as shown in Fig. 2c and d). Simulations were conducted with the conditions (Ue = 120 V, Uc = 10 V, d = 120 μm), and chemical reactions detailed in Table SI. We calculated electron density (ne), positive ion density (n+), collecting current density (jc), and cathode current density using the Laplace equation with gold (Au), graphene, and CNTs as cathode materials. Results (Fig. 5 and Table S2) showed that the ionization properties of Au-cathode sensor remained higher compared to other materials in both structures. To authenticate these findings, we tested sensors with Au-nonporous, CNTs, and graphene cathodes (the sensor fabrication process shown in Fig. S1)11,14,34 using a Φ = 6 mm structure (Fig. 6a). At 40 °C, with Ue = 80 V, Uc = 10 V, and d = 120 μm, the Au cathode sensor showed a single-value decrease in collecting current as H2 concentration increased from 1 ppm to 400 ppm, with a sensitivity of -4 pA/ppm. In contrast, CNTs and graphene exhibited multi-value decreases with sensitivities of -2.1 pA/ppm and − 1.8 pA/ppm, respectively. At 50 °C, with Ue = 200 V, the Au sensor’s sensitivity rose to -9.6 pA/ppm, surpassing CNTs at -5.5 pA/ppm.
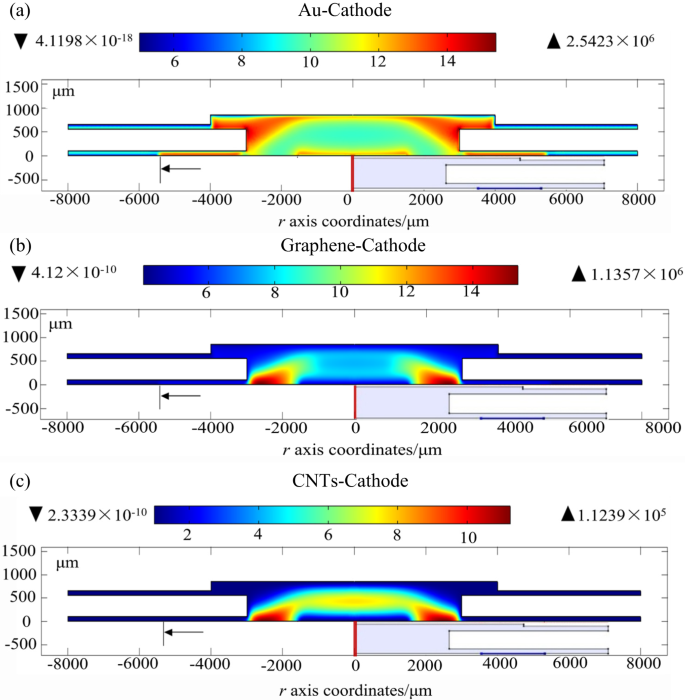
Simulation results on gas discharge characteristics in different cathode-materials (a) electron density distribution of Au-cathode sensor, (b) electron density distribution of graphene-cathode sensor and (c) electron density distribution of CNTs-cathode sensor.
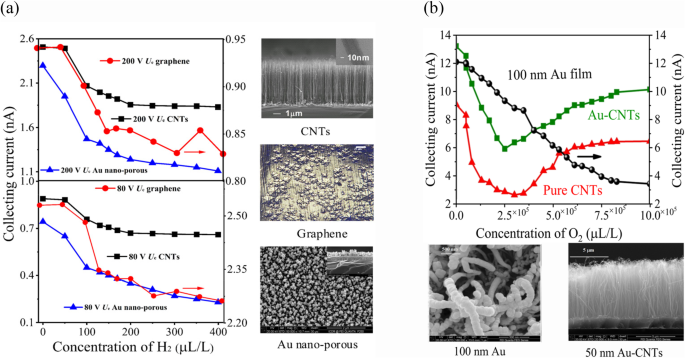
The effect of graphene, gold-coated CNTs, 150 nm gold nanostructure film, and pure CNTs cathode on sensor performance. (a) The sensitivity comparison of a graphene, CNTs cathode, and gold nano porous cathode using a Φ = 6 mm sensor at varying voltages 200 V Ue and 80 V Ue. At 200 V Ue, 10 V Uc, and 120 μm spacing (d), unlike pure CNTs and graphene cathode (which decreased in a multivalve manner), the collecting current of the sensor with Au nanoporous cathode decreased in a linear trend as the H2 concentration increased from 0 to 400 ppm. Similar results were observed when the supply voltage was changed to 80 V Ue. (b) The performance impact of a Φ = 6 mm sensor using different diameter coating of gold nanomaterial and CNTs cathode. At 25°C, 150 V Ue, 1 V Uc, and 100 μm spacing (d), the sensor with 150 nm Au-nanomaterial film cathode showed a constant decrease in collecting current as the O2 concentration increased from 1 ppm to 10 × 105 ppm, while pure CNTs and Au-CNTs with 50 nm coating cathode sensors exhibited multi-value sensitivity.
Similarly, for the Φ = 2 mm structure, we tested 150 nm Au-coated, 50 nm Au-coated CNTs, and pure CNTs cathodes. At 40 °C, with Ue = 75 V, the 150 nm Au cathode sensor’s current decreased from 12 nA to 4.6 nA as O2 concentration increased to 10 × 105 ppm (Fig. 6b), showing higher sensitivity of -11.09 pA/ppm. CNTs and 50 nm Au-CNTs showed multi-value decreases. The 150 nm Au cathode maintained a higher current, enhancing performance. These results confirm above simulation results that the Au cathode exhibits superior discharge characteristics, increasing charge induction and collecting current density in both senor structure, as confirmed from simulation results.
Furthermore, we also measured the oxidation resistance of cathode material using a Φ = 1.2 mm sensor with CNTs, 150 nm Au, and graphene cathodes under 75 °C, 250 V Ue, 10 V Uc, and 100 μm spacing with continuous discharge concentration of O2. The graphene-cathode sensor’s discharge current dropped sharply as O2 concentration rose from 0 to 30%, weakening at 30% as illustrated in Fig. S6. The pure CNTs cathode declined at 33% O2, losing functionality. In contrast, the 150 nm Au-cathode sensor showed a consistent decrease in discharge current, even at 100% O2, demonstrating exceptional stability. This indicates that the 150 nm gold nanomaterial is highly reliable for stability and longevity in ionization-based gas sensors.
Effects of field emission properties on three-electrode sensor performance
The performance of a sensor is influenced by the height (h) and spacing (x) of its cathode nanomaterials19,33. The electric field intensity near cathode nanotips affects the collecting current (Ic), emission current, and gas discharge. For optimizing the Φ = 1.2 mm sensor, we calculated the field enhancement factor for a 150 nm Au-nanostructured cathode. By determining the effective area (SAuF) with a set radius (r) and average spacing (x) of Au nanostructures (Fig. S7), and evaluating the electric field intensity. The results suggested in Fig. S6, S7B, when spacing exceeds twice the height, it no longer affects γ. Therefore, the aspect ratio and height were considered to influence the field enhancement factor. Therefore, we fabricated a 150 nm Au nanostructured cathode using TCVD, with a radius of 25 nm, spacing of 300 nm, and height of 600 nm (Fig. S8). This configuration provided strong field strengths, enhancing gas ionization and cathode electron emission. The optimized Φ = 1.2 mm sensor was then tested for emission current under various voltage and temperature conditions.
Nitrogen gas sensitivity varied with different voltages and temperatures (see Supplementary Table S3, S4). We verified our computational findings by detecting SO2 gas at the ppb level in an SF6 background, with temperatures of 40 °C to 50 °C and voltages of 100 V and 150 V of Ue. The SO2 sensor showed higher sensitivity at 50 °C and 150 V Ue (Fig. 7a). At 40 °C, the sensor’s Ic decreased in a multi-valued manner, indicating sensitivity to voltage and temperature changes. Maximum sensitivity was 203 pA/ppm at 0.02 ppm, 150 V Ue, and 50 °C. As SO2 concentrations increased from 0.02 to 650 µL/L, the Ic decreased from 11.92 nA to 1.36 nA at 50 °C and from 4.828 nA to 1.76 nA at 40 °C. We also detected methane in nitrogen to verify emission current changes with temperatures of 30 °C to 75 °C and voltages of 50 V and 150 V.
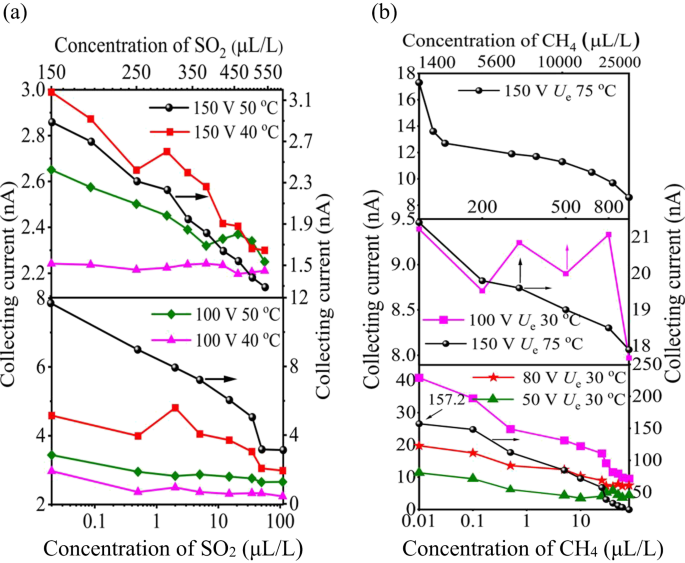
The impact of temperature and electric field on the novel sensor performance. (a) The sensor shows single value decrease collecting current to high voltages of 150 V Ue and temperatures 50°C in SF6 mixtures, however it exhibited multi-value collecting current at lower voltages and temperature. (b) The collecting current of the CH4 sensor variably decreases with increasing concentrations from 0.01 to 25,000 ppm, specifically at 150 V Ue and 75°C of temperature exhibited higher sensitivity.
As illustrated in Fig. 7b, the Φ = 1.2 mm sensor demonstrated high sensitivity to trace methane concentrations, with consistent current decreases from 0.02 to 80 ppm and maximum sensitivity of -31.8 pA/ppm at 0.01 ppm CH4, 150 V Ue, and 75 °C. As CH4 concentration increased from 80 to 800 ppm, the current dropped from 22.78 nA to 17.80 nA at 150 V Ue and 75 °C, but showed multi-valued sensitivity at 100 V Ue and 30 °C. This behavior aligns with the field-assisted thermal emission law. Therefore, temperature affects the emission current, as pure N2has a linear relation11–16 with collecting current density jc/A∙m−2 as confirmed by simulations.
Sensor performance using two and three gases mixtures
The sensor’s non-linear response between Ic and denables simultaneous detection of multiple targets11,14. We employed two and three novel 1.2 mm sensors with varying electrode separations to measure CH4-CO and H2-C2H2 mixtures in N2. We also demonstrated how different power supplies affect the sensor’s ability to detect three-gas mixtures at ppm and ppt levels.
Firstly, we fabricated two Φ = 1.2 mm sensors with d of 100 μm and 120 μm to detect CH4 (0-1000 ppm) and CO (0 - 5000 ppm) concentrations. At 50 °C, 120 V Ue, and 1 V Uc, the 100 μm sensor exhibited a maximum sensitivity of -378 nA/ppm at 0.5 ppm CH4, as shown in Fig. 8. The 120 μm sensor had a maximum sensitivity of -151.1 nA/ppm for 24 ppm CO but exhibited higher cross-sensitivity to CH4 (-7.09 × 10⁻⁴ ppm-1) compared to CO (-1.98 × 10⁻⁴ ppm-1), indicating a stronger CH4 effect on CO detection. We also tested H2-C2H2 gas mixtures using the same electrode spacing and compared these results with a Φ = 6 mm sensor array. The Φ = 1.2 mm sensor array demonstrated enhanced sensitivity (see Fig. S9), achieving − 345 nA/ppm at 5 ppm C2H2 and − 29 nA/ppm at 155 ppm H2, which was twice as high as the Φ = 6 mm sensors performance11,14.
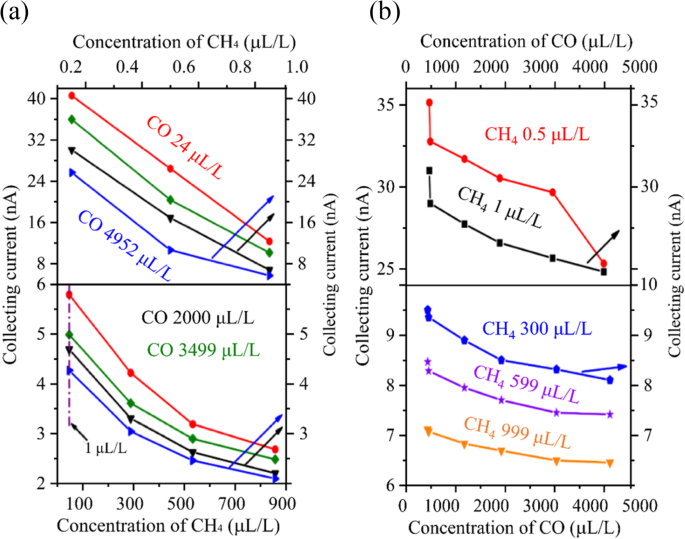
Detection of a CH4-CO mixture in N2 background using two different inter-electrode spacing sensors. (a) At 50°C, 120 V Ue, and 1 V Uc, the 100 μm sensor for the test of CH4 concentration in the rage of 0-1000 ppm and (b) 120 μm sensor for the detection of CO in the rage of 0-5000 μL/L.
Secondly, we evaluated a three-sensor array (d = 75/100/120 µm) for detecting three-component mixtures using DC and RF power supplies. While DC detection mechanisms for CNTs cathode sensors were previously reported11,14, however, here our focus was on optimizing the performance of ionization sensor. Therefore, first we assessed the impact of RF and DC power supplies on the sensor’s discharge characteristics using a fluid model (see Fig. 2d). Simulation results as illustrated in Fig. 9, S10 and Table 4, we calculated the ionization characteristics such as the electron energy, ne, n+, Jc, and Jcathode distribution on the sensor’s cathode surface under DC and RF excitation modes. The results shows that under DC excitation, the positive ion density on the cathode surface steadily accumulates and eventually stabilizes. Under RF excitation, the ion density fluctuates with changes in the RF electric field’s direction and magnitude, with a gradual increase in peak density. This suggests that RF excitation induces positive ions and partially mitigates charge accumulation, although many ions oscillate between the electrodes due to the high frequency. Compared to DC excitation, RF excitation reduces cation density by about three orders of magnitude, minimizing ion bombardment and charge buildup on the cathode. This promotes discharge uniformity and stability, thereby improving the sensor’s hysteresis effects.
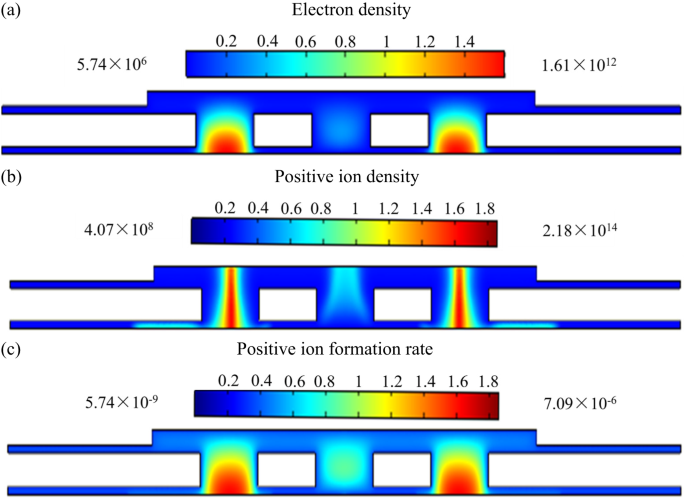
Gas discharge characteristics under RF excitation. (a) Electron density distribution, (b) electron density distribution and (c) positive ion formation rate of the sensor.
Then, we experimentally determined the impact of RF supply on discharge current on electrode separations in pure N2, with DC effects already reported previously11,14. Using a five-sensor array with electrode spacing from 60 μm to 120 μm, and maintaining conditions of 27 °C, 22.4% humidity, and even with wider spacing. Increasing RF power from 1 W to 6 W at 1.5 MHz resulted in a consistent rise in discharge current, from 51.21 nA at 1 W to 5123 nA at 6 W (Fig. S11). Due to system limitations, we chose 6 W power at 1.5 MHz for detecting trace SO2, NO, and O2.
We fabricated a three-sensor array with 75 μm, 100 μm, and 120 μm electrode spacings for detecting SO2, NO, and O2. Using RF power at 1.5 MHz and 6 W for ppt-level detection (see Fig. S12) and DC voltage (Uc = 10 V, U e = 120 V) for ppm-level detection (see Fig. S13). We found that the 75 μm sensor, tested at 27 °C, 22.4% humidity, and 1 atm, showed a consistent decrease in Ic with increasing SO2 concentration from 0 to 1000 ppt. It achieved a sensitivity of -445 pA/ppm at 2 ppt of SO2 (see Fig. 10a), surpassing its DC counterpart see Fig. S13C and 6 mm sensors11,35. This sensor also exhibited the highest cross-sensitivity of 2.65 × 10⁻¹ nA/ppm-1, indicating significant interference from O2 and SO2 in NO detection (see Table 5). Similarly, the sensor with a d = 100 μm, Ic decreased consistently as the concentration increased from 1 ppt to 1000 ppt in Fig. 10b, it also demonstrated increased sensitivity of -605 pA/ppm to a concentration of 20 ppt of NO, surpassing the sensitivity of its DC power supply sensor (Fig. S13B) and the Φ= 6 mm sensor11,35. The sensor exhibited a strong influence of SO2 and O2 component with a cross-sensitivity coefficient of 2.23 × 10⁻⁴ nA/ppm−1 in NO detection, notably higher than that of the 75 μm sensor interference (Table 5). Moreover, the 120 μm sensor exhibited a -510 pA/ppm sensitivity to 10 ppt O2 (see Fig. 10c), outperforming its same sensor wit DC power supply sensitivity (Fig. S13A). It exhibited a consistent decrease in current with rising O2 concentrations from 1 ppt to 5000 ppt, though affected by SO2 and NO with a cross-coefficient of -2.42 × 10⁻⁵ nA/ppm-1. RF power significantly enhanced sensitivity and selectivity compared to DC as it evidenced in simulation results (Table 6). The 1.2 mm sensor was three orders of magnitude more sensitive than the 6 mm sensor11–16,35, demonstrating its effectiveness in detecting multiple gases at trace levels and supporting integrated sensor development.
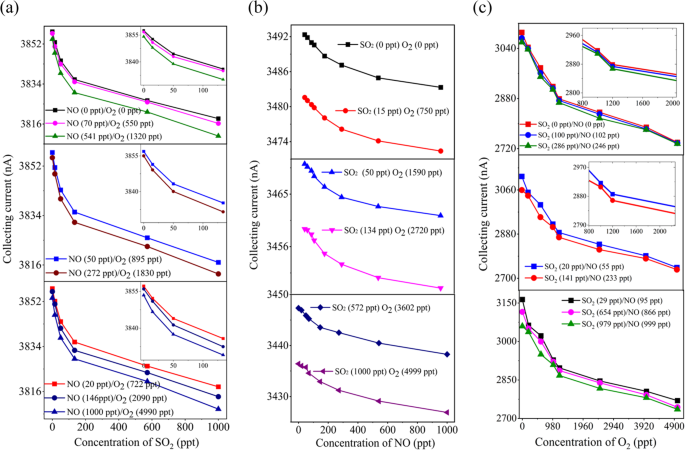
Simultaneous detection of trace concentration of a SO2/NO/O2 mixtures using radio frequency voltages (Urf) in N2. (a) At Ue 1.5 MHz 7 W, Uc 10 V, 27°C temperature, 22.4% RH, and 1 atm gas pressure, the collecting current of the 75 μm electrode spacing sensor decreases in single-value sensitivity as the SO2 concentration increases from 0-1000 ppt, (b) the collecting current of the 100 μm and (c) 120 μm electrode spacing sensors also decreases in a single-value sensitivity as the concentration of NO and O2, increases.
Technical assessment of the sensitivity, repeatability and response time
The performance of the nanomaterial-based gas sensor is evaluated through the response/recovery time (see Fig. 11), sensitivity (see Fig. 10), linearity (see Fig. S14), and repeatability (see Fig. 12). Sensitivity S is calculated as S, S = ΔIc/Δϕ, for single gases, binary, and ternary mixtures. The three-electrode ionization sensor exhibits sensitivity that is approximately ∼ 2 – 3 orders of magnitude greater than other sensors (see Table 6).
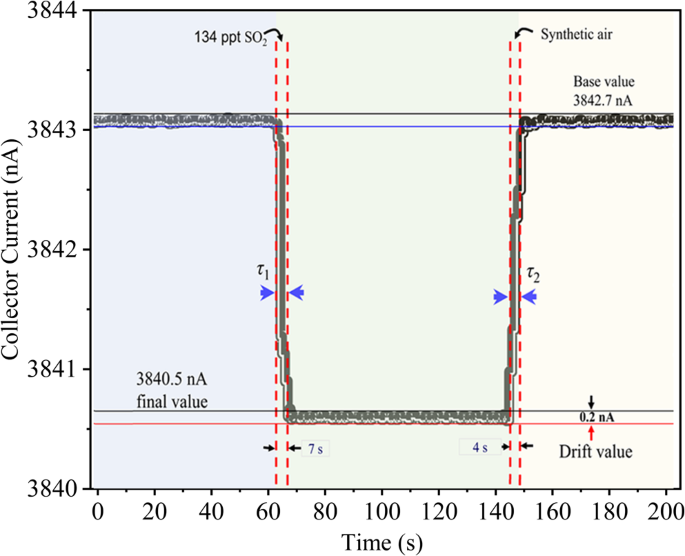
Response recovery time of the ionization based three-electrode novel gas sensor.
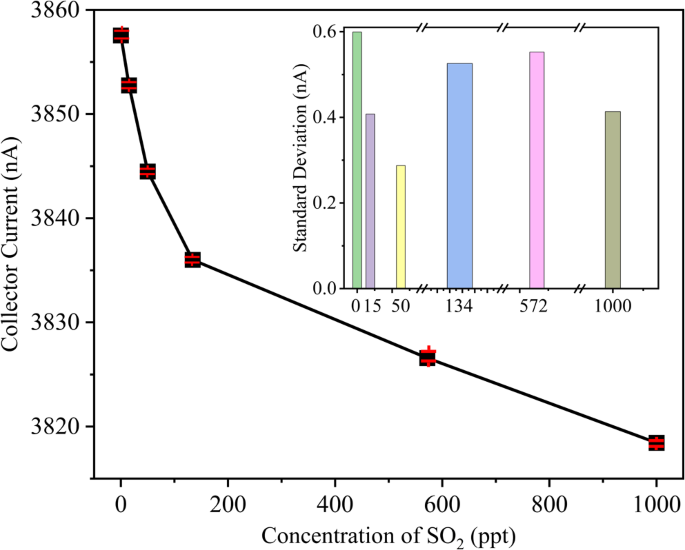
Collecting current vs measured curves of ten times repeated measurement of the 75 μm separation SO2 sensor.
Cross-sensitivity measures how gases affect each other’s readings. It quantifies the change in output per unit of interference, with Si−j representing the impact of the jth gas on ith gas parameter, where i≠j and i, j ∈ {1,2,3} corresponding to SO2, O2, and NO.
$${S_{{\text{i-j}}}} = \frac{\Delta I_{\text{cmi}}}{I_{\text{cF.Si}} \times \Delta_{x\text{j}}}$$
(13)
Here, ΔIcmSO2 is the maximum deviation in the IC of the ith, and jth sensors, such as ϕSO2 (e.g., x1) and Δxj is the change in the jth parameter. IcFSi denotes the maximum deviation between the highest and lowest IC values of the ith and jth sensors due to the targeted parameter. For instance, when i and j refer to NO and O2 respectively, ICFSO2= ICSO2 − IcNO− IcO2. Smaller Si−j values indicate stronger interference from the jth parameter on the ith sensor. For example, the maximum cross-sensitivity values are − 0.265 nA/ppm for SO2 with NO and O2, -2.23 × 10⁻⁴ for NO, and 2.42 × 10⁻⁵ for O2 (see Table 5).
We performed repeatability experiments 10 times (see Fig. 12) and assessed the relative error (r), standard deviation (σj), and repeatability error (δR) for the novel sensor (see Table 6) according to the relevant standards14. The results demonstrate that all three sensors exhibit impressively low relative and repeatability errors, both below 3.1% (refer to Table 6), indicating excellent repeatability. In Fig. S14, the sensitivity curves were fitted using various algorithms, including logarithmic, cubic, and quadratic functions. The logarithmic fitting model yielded the lowest mean squared error (MSE) compared to the others.
In gas detection, timing metrics are crucial. This study measured the response time (τ1) and recovery time (τ2) of a new triple-electrode ionization sensor. The sensor responded in 7 s and recovered in 4 s when switching from synthetic air to an SO2 mixture, with these times representing t90 and t10 (see Fig. 11). This quick response underscores the sensor’s superior adaptability and performance compared to our previous and other sensors (see Table 6).
As no other research closely matches our work on sensor arrays, we compared the performance of our proposed sensors with existing single-gas and mixture detectors (see Table 6). Our sensor’s sensitivity is 2 – 3 orders of magnitude greater than that of others, and it exhibited the smallest linearity error, relative error and repeatability errors no more than 4.1%, 2.9% and 3.1% respectively. The triple-electrode ionization sensor array offers a low detection limit for multiple gases, high sensitivity, and improved integration.
link


