
Design and optimization of honeycomb structure in dual-link mechanism for revolving two-wing doors

Some problems will occur after the simulation and optimization of the substrate of the double-link structure. Through the simulation optimization process, it can be observed that there are multiple unloaded areas in the local regions of the substrate. Therefore, the area of these regions can be reduced. Since honeycomb structures exhibit porosity, it is proposed to investigate the performance of honeycomb structures as a potential replacement for the substrate structure. This part aims to replace the key part of the double-link structure, that is, the substrate, with a honeycomb structure. The honeycomb structure has relatively good specific strength and light weight. Therefore, this part studies its mechanical properties with the expectation of replacing the substrate component.
The honeycomb structure is fabricated by a bottom-up processing method. The fabrication process is described as follows: Firstly, the stamped corrugated board and aluminum flat plate are processed into the required sizes and then polished. After that, an aluminum flat plate is laid flat, and an adhesive is evenly applied on one side of the aluminum flat plate, and then the corrugated board is laid flat on it. Next, the adhesive is applied on the corrugated board, and another aluminum flat plate is placed flat on it. Then, the adhesive is applied on the other side of the flat plate, and the corrugated board is placed at a 90° angle to the previous layer. Further, follow the previous processing steps until the required height is reached, and finally, a structural material with the holes of two layers of corrugations perpendicular to each other is formed. The processes of plate polishing and adhesive coating are as follows. Polishing is carried out using 1000-mesh sandpaper, and after polishing, the average surface roughness Ra of the plate is 0.35 μm. The coating thickness of the applied adhesive is 0.2 mm. The curing time of the sample at room temperature is 24 h. The shape of the holes in the honeycomb structure is shown in Fig. 5. The holes are in a trapezoidal structure, where the upper side length a of the trapezoid is 2.5 mm, the lower side length b is 5 mm, the plate thickness t0 is 0.4 mm, the height h is 2.2 mm, the included angle θ is 120°, and the relative density of the material is 0.98 g/cm3. The overall size is 50 * 50 * 20 mm.

Experimental mechanics of the honeycomb structure
The deformation process of the material is shown in Fig. 4 below. The upper end of the honeycomb structure is loaded while the lower end is fixed. The experimental process for the honeycomb structure was carried out using a hydraulic testing machine manufactured by Jinan Time Testing Machine Co., Ltd., with a maximum loading capacity of 500 kN. As the loading time increases, the collapse and deformation of holes occur at the lower and upper layers of the honeycomb structure, and the height of the honeycomb structure gradually decreases. The quasi-static compression test uses a loading speed of 5 mm/s, and the test stops when the material deforms by 70%. During the process, the equipment automatically records force and displacement data. The deformation and collapse process of the honeycomb structure does not occur layer by layer, which is inseparable from the defects existing in the processing and preparation process of the honeycomb structure. The first deformation of the honeycomb structure always appears at the defective positions. After that, the honeycomb structure further undergoes the deformation process along the positions where the deformation first occurred, and the height of the honeycomb structure further decreases until complete densification occurs (Fig. 6).

Material deformation process.
The stress–strain and energy absorption curves of the material are shown in Fig. 7. By observing the stress–strain curve of the material, it can be found that there are clearly three stages for the material, namely the elastic stage, the slow-rising stage, and the rapid-rising stage of the material. Generally, the range of the elastic stage of the material is relatively small, with the strain within 0.05. Its characteristic is that the curve is relatively straight and close to a straight line. There is usually an obvious peak at the end of the elastic stage, which can be clearly distinguished from the slow-rising stage. The energy absorption interval of the material is mainly concentrated in the slow-rising stage. In this stage, the curve is relatively gentle and shows a slow upward trend. The collapse and deformation of the holes in the material basically occur in this stage. Here, the densification strain point of the material is defined as the abscissa value at the intersection of the slope of the elastic stage and the material curve. After that, the material enters the densification stage (match the deformation process shown in Fig. 6).

Material stress–strain-energy absorption curve.
The plateau stage of the material is the main energy absorption stage of the material, which is between the deformations of 0.05 and 0.5. The reason why there is a gradual upward trend in this stage is that after the holes in the material collapse and fold, the flat plates and the hole walls are stacked together, the thickness of the material increases, and stress strengthening occurs. The effective energy absorption per unit volume of the material can reach 25.5 MJ/m3.
Theoretical analysis of the mechanics of the honeycomb structure
The first crushing stress is defined as the average external stress that the first crushed corrugation undergoes during the entire crushing process. According to the law of conservation of energy, the work done by external forces during the entire crushing process is equal to the energy dissipated by plastic deformation. Among them, the energy dissipated by plastic deformation is mainly the energy dissipated by the wrinkles generated on the edges and waists that turn to the vertical direction.
The ideal deformation situation of a single trapezoidal hole is shown in Fig. 8a. That is, when a unit cell is subjected to an external load, there is no change at the top of the unit cell, and symmetrical inward folding occurs on both sides of the unit cell, with a plastic hinge deformation formed at each end. Taking a certain unit cell as the research object, it can be known that under the ideal state, the deformation of the material is that the two side walls collapse and wrinkle inward, and the energy absorption is mainly the bending deformation energy when the two side walls deform. However, in the actual experiments and simulation processes, the material shows the deformation mode shown in Fig. 8b, that is, one side appears in a state of bending and wrinkling deformation, while the other side appears in a state of being compacted after rotational deformation.
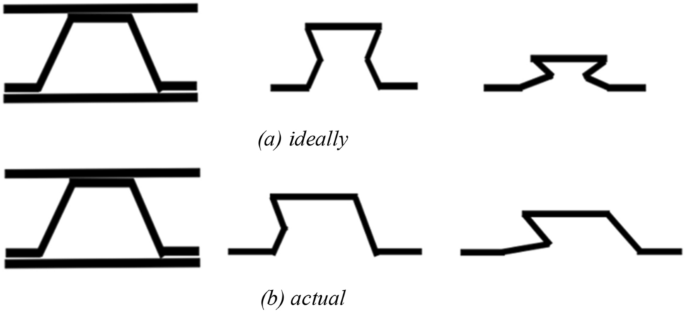
Deformation process of the single cell of material.
That is to say, the energy absorption of a single hole can be simplified into two parts (Formulas 1 and 2).
$${{E}} = {{E}}_{1} + {{E}}_{2}$$
(1)
$$E_{1} = M_{0} \times \frac{2}{3}\pi \times a,\quad E_{2} = M_{0} \times \left( {\frac{3}{2}\pi + 3\pi + \frac{3}{2}\pi } \right) \times \frac{a}{2},$$
(2)
In the formula \(M_{0} = \frac{1}{4}\sigma_{0} {\text{t}}_{0}^{2}\), \(\sigma_{0} = \sqrt {\frac{{\sigma_{{\text{y}}} \times \sigma_{u} }}{1 + n}}\), where σy is the yield strength, σu is the ultimate stress, n takes the value of 0.223, and θ represents the angle through which the material rotates.
Under the working condition environment, the actual effective energy absorption interval of the material used for the test is approximately 50%. Therefore, the energy absorption per unit volume of the honeycomb structure under theoretical calculation is approximately 28.5 MJ/m3, and the energy absorption under test conditions is approximately 25.5 MJ/m3. There is an error of 10.5% between the test and the theory. The main reason for the error is that the theoretical calculation is too idealized, that is, the material deformation cannot reach the fully compacted angle in the calculation. On the other hand, the uneven application of the adhesive will also cause a certain error.
Simulation of the mechanics of the honeycomb structure
Ansys student is used to simulate the deformation process (Ansys for Students The simulation parameters of the material are shown as follows. The base material is 5052 aluminum alloy, and the influence of the adhesive is ignored. The material parameters are set based on experimental data, including density is 2770 kg/m3, elastic modulus is 710 GPa, Poisson’s ratio is 0.33, and the constitutive relationship adopts a bilinear isotropic hardening model (Yield stress is 280 MPa, Tangent modulus is 500 MPa). By observing the simulation results of the material (Fig. 9), it can be found that when the material is subjected to external loads, it undergoes collapse deformation. Different from the deformation situation in the test process, the deformation of the material under simulation occurs evenly in the holes of each layer. This is because the simulated material is homogeneous and regular, while the material used in the test has defects. Therefore, in the experimental process, the deformation always first appears at the defective positions. As the loading process progresses, the sample is gradually compressed until the holes are compacted.

The simulation deformation process of orthogonal trapezoidal honeycomb aluminum.
By comparing the stress–strain curves of the test and the simulation process (Fig. 10), it can be found that within the strain range of 0.5, the two are relatively similar. Both show a slow upward trend after the elastic stage. The stress–strain curve in the test process is relatively flat and smooth, while the simulation curve fluctuates. This is caused by the meshing in the simulation process. Smaller and finer meshing leads to smaller stress fluctuations, while coarse meshing will result in larger fluctuations. However, fine meshing is prone to increasing the calculation time and wasting resources. Therefore, the number of meshes should be within a reasonable range.

Comparison of experimental and simulated stress–strain of honeycomb structure.
By comparing the performance of the solid substrate with that of the honeycomb structure, it can be seen that the solid substrate can meet the performance requirements when subjected to external loads. The stress of the substrate is approximately 20.3 MPa, and the deformation of the substrate is about 0.1 mm. For the solid substrate and the honeycomb substrate with the same volume, the mass of the solid substrate is approximately 1600 g. After reasonable lightweight design, the mass of the solid substrate is 1300 g, while the mass of the honeycomb structure used as the substrate is approximately 160 g. Comparing the mechanical properties of the honeycomb structure substrate, when the stress is 20.3 MPa, it is still in the elastic stage, and the honeycomb substrate has not undergone plastic deformation. This indicates that it is feasible to replace the solid substrate with the honeycomb substrate.
link


